

Worksheet tutorial
Learn how to search, filter, and visualize your data in a new Worksheet.
From the left navigation, click Worksheets to access the Worksheets Explorer and view all the Worksheets in your Observe by Snowflake instance.
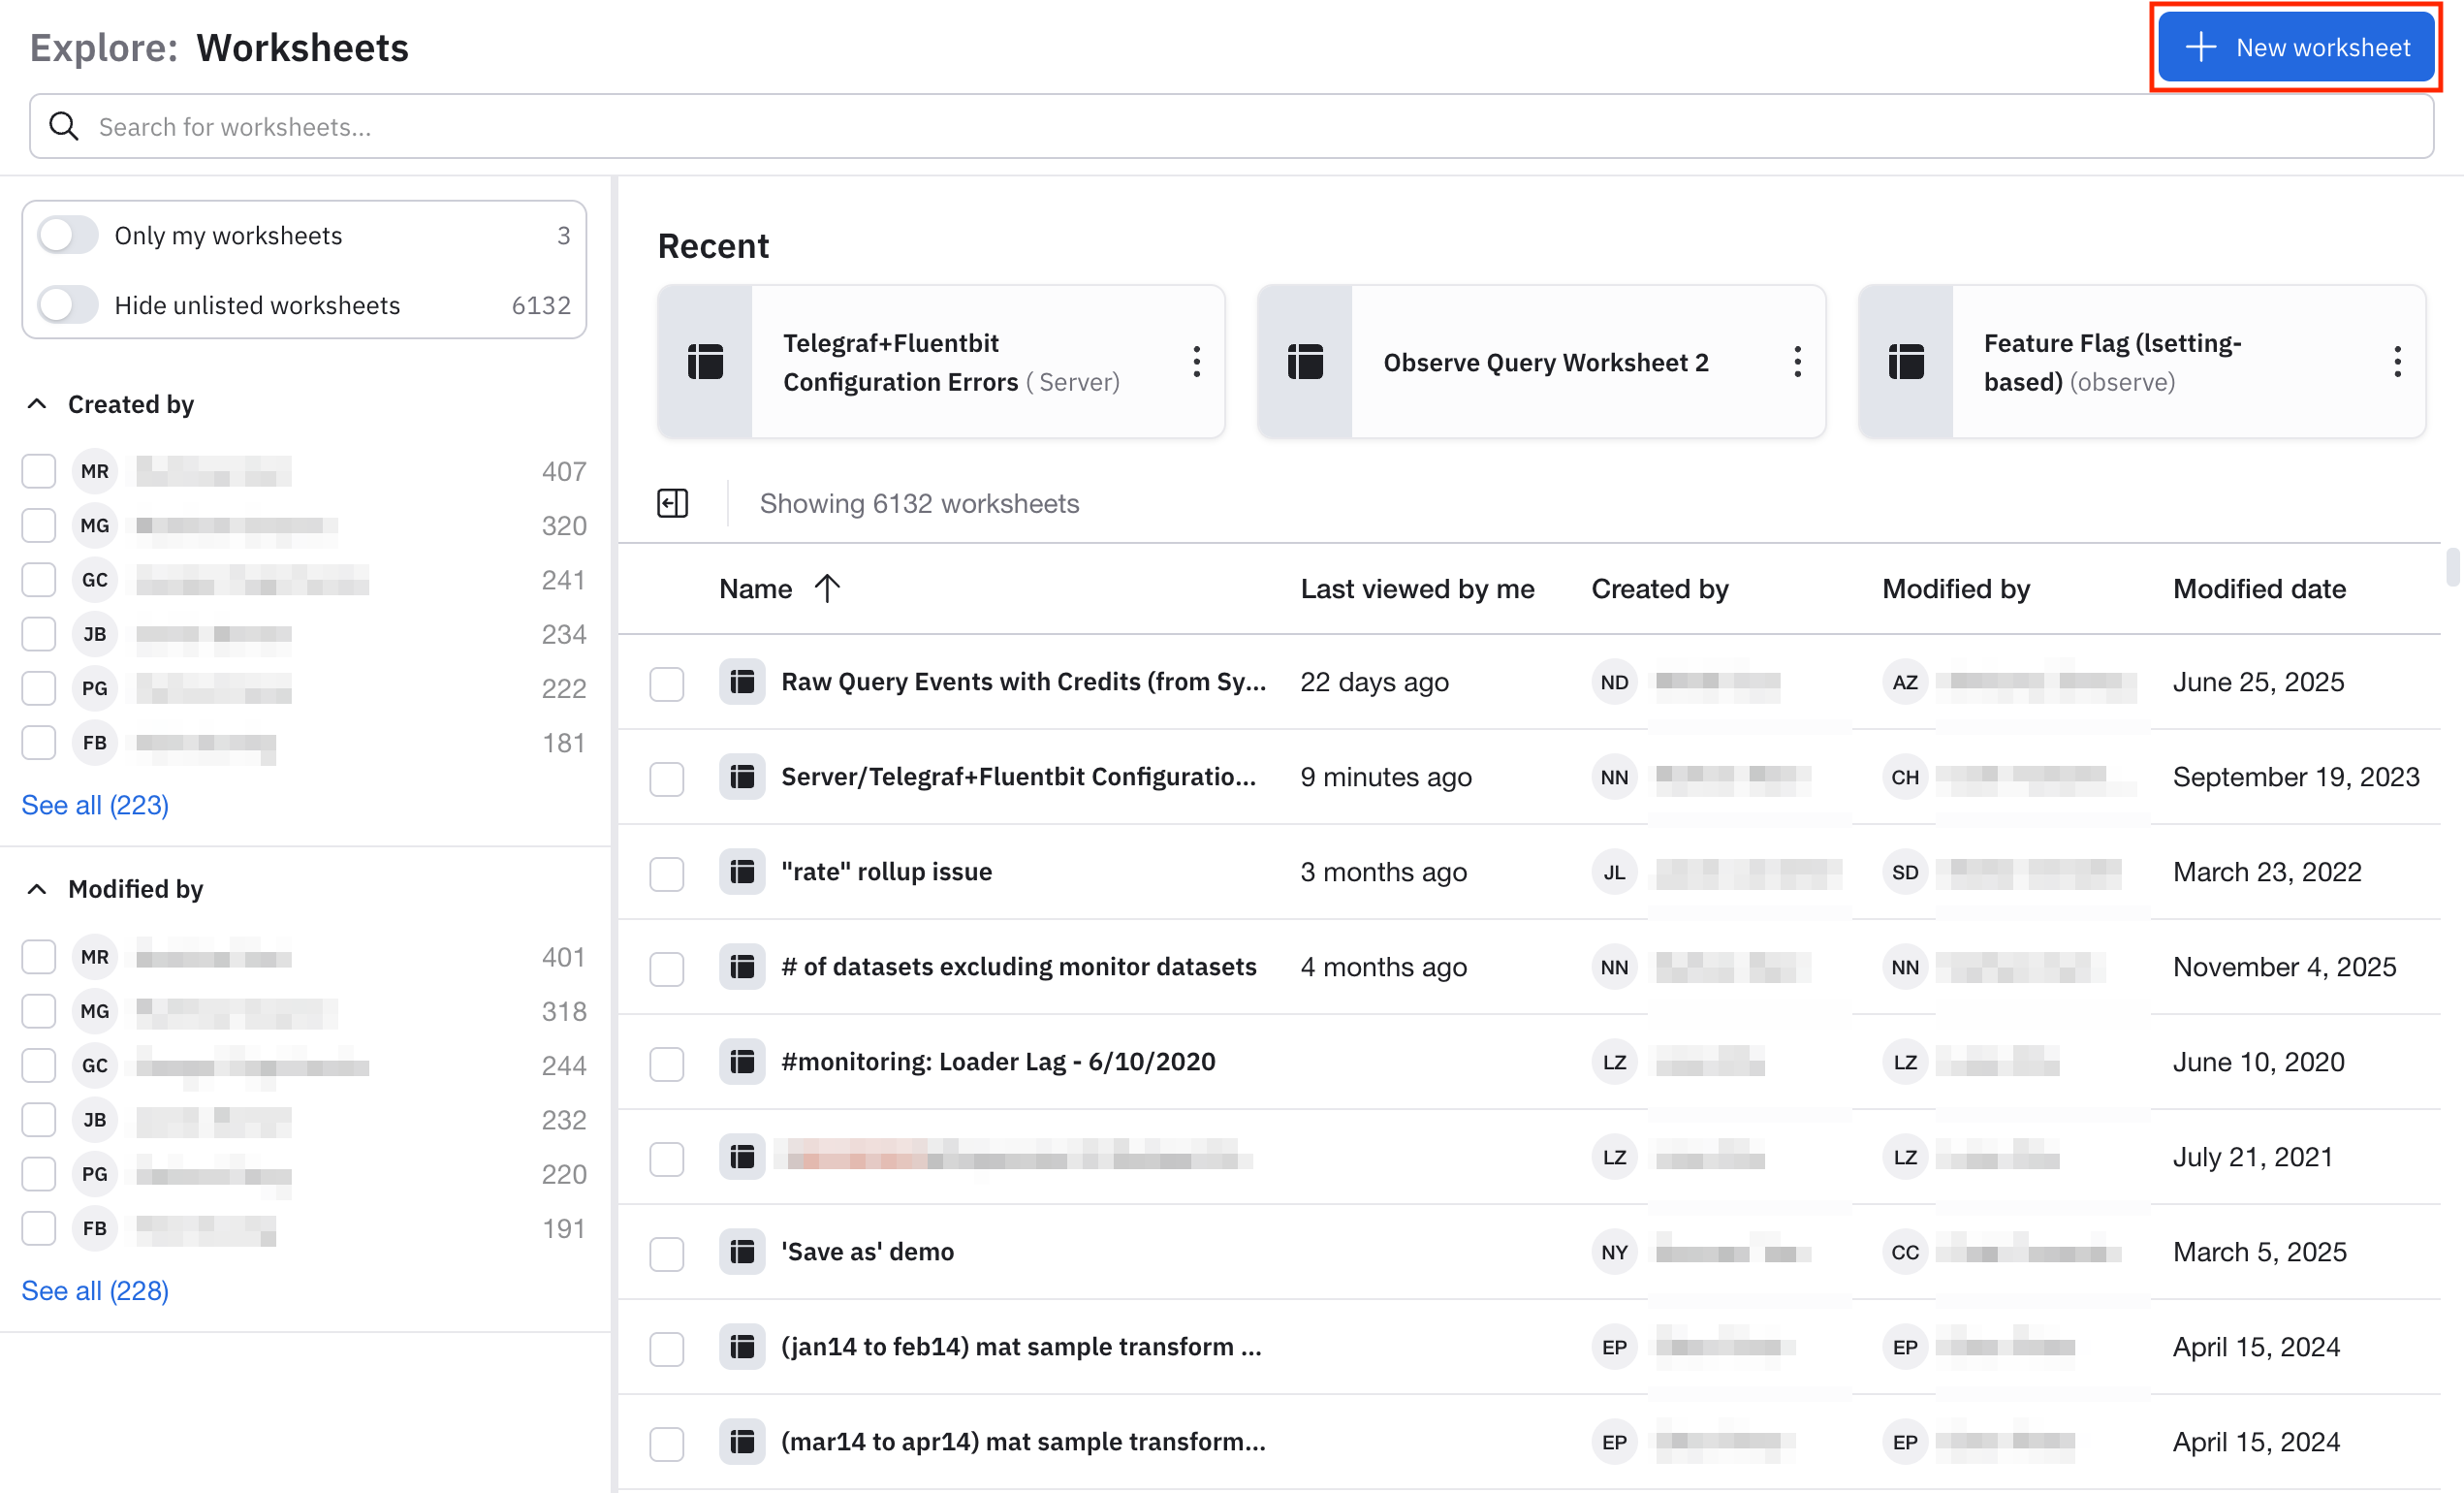
Click New worksheet to begin creating a new Worksheet.
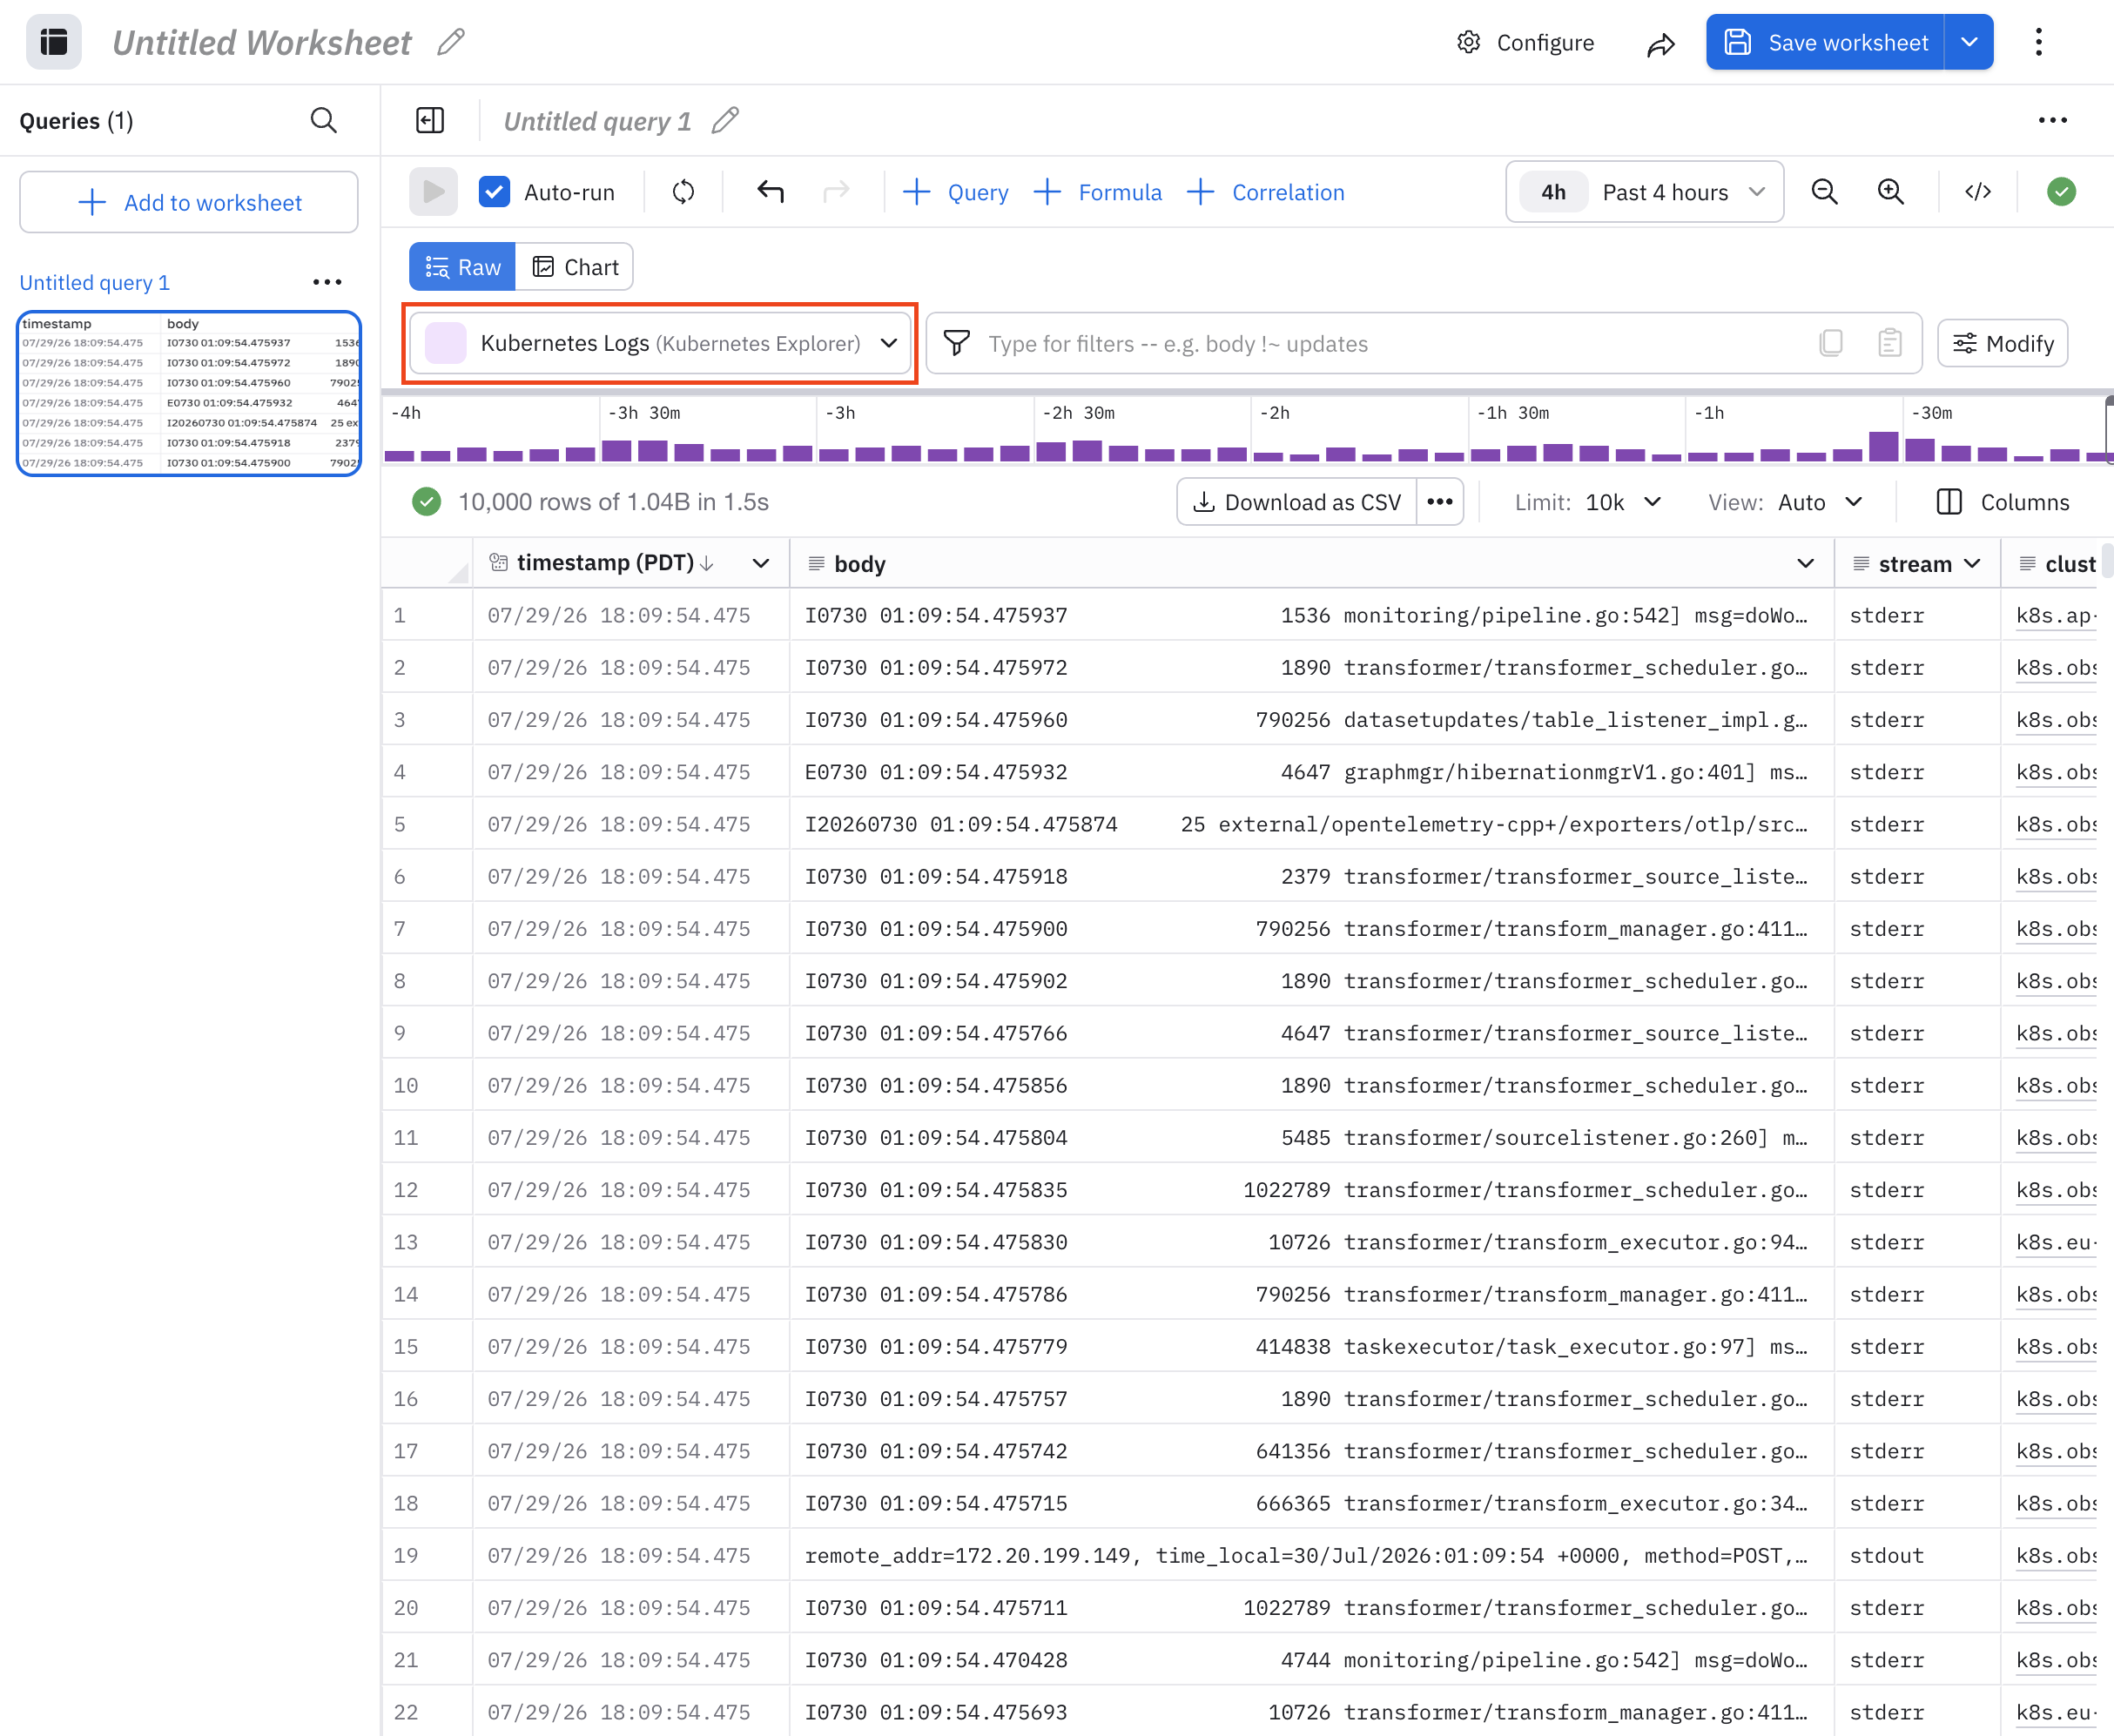
Worksheets are composed of one or more Queries. Each Query in a Worksheet can be independently constructed. Each Query can have any number of Inputs and associated OPAL.
Add Kubernetes Logs as the input to your first query.
Search your data in the filter bar
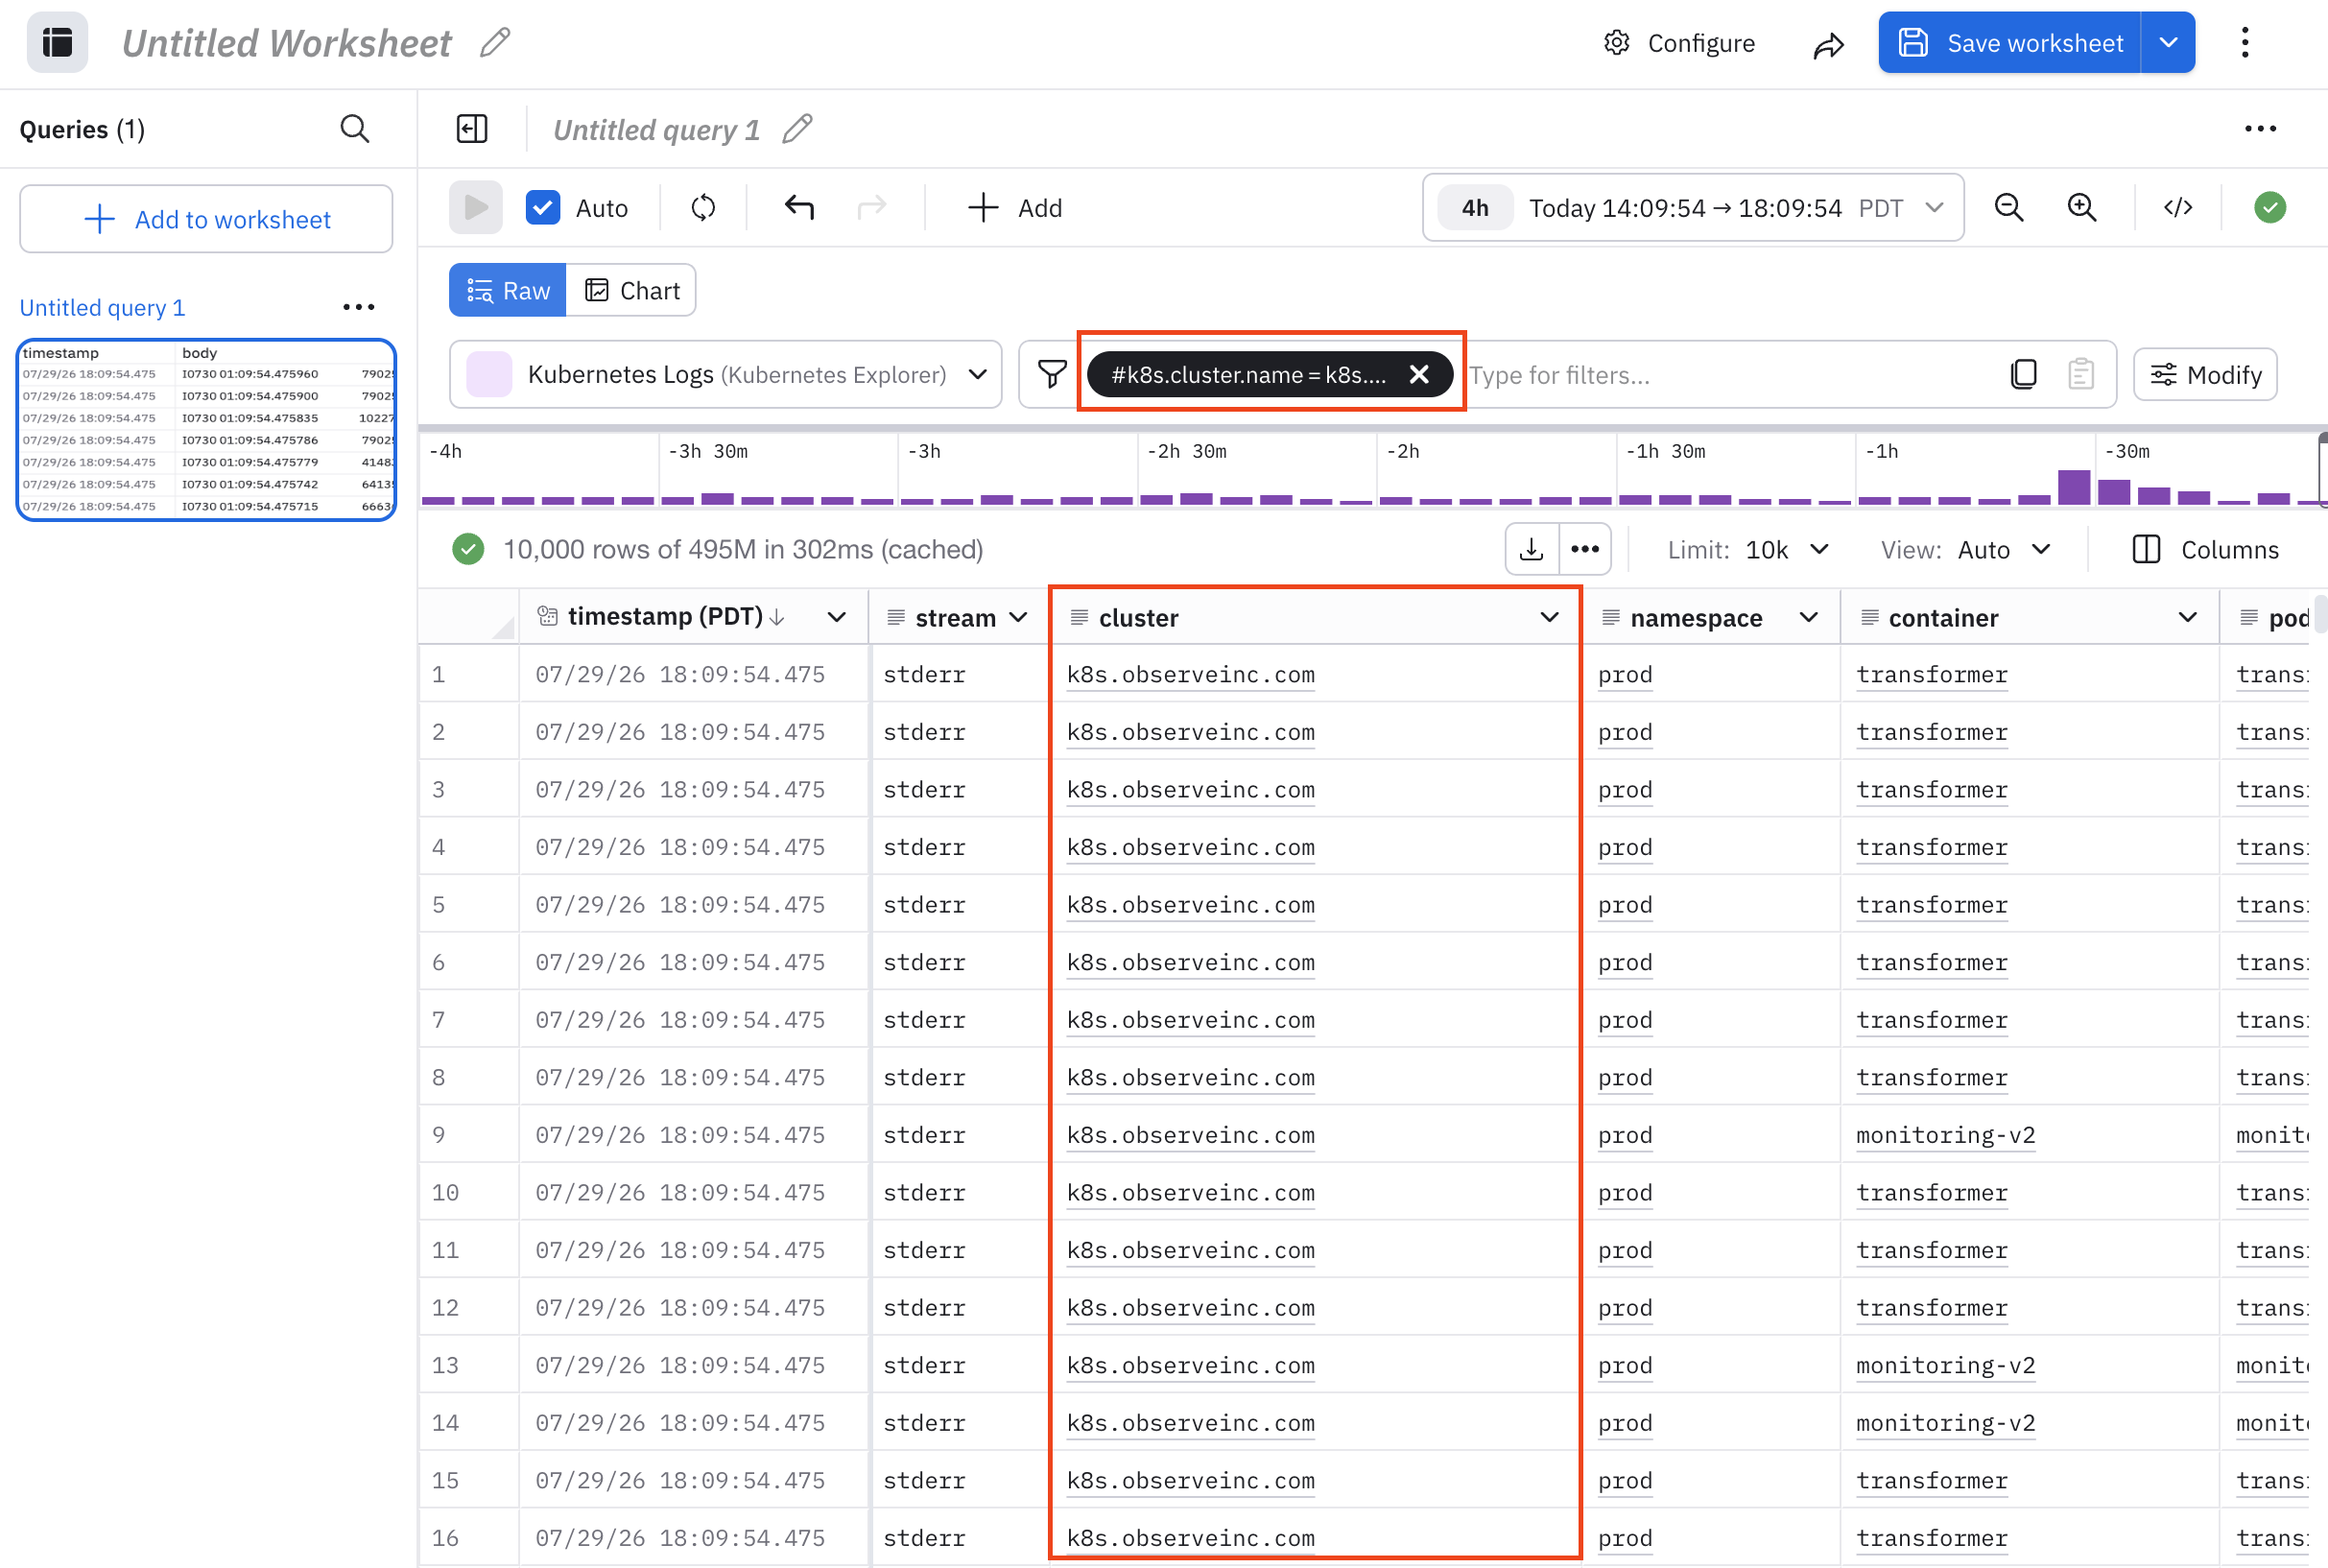
Once you've gotten data into your Worksheet, the simplest way to start searching or filtering is to use the filter bar at the top of the Worksheet. If you know how to build queries, you can enter your query directly into the filter bar. Or, you can click in the filter bar and use then pick the correlation tags or fields and their values. For example, we can add the filter where the #k8s.cluster.name correlation tag has the value k8s.observeinc.com:
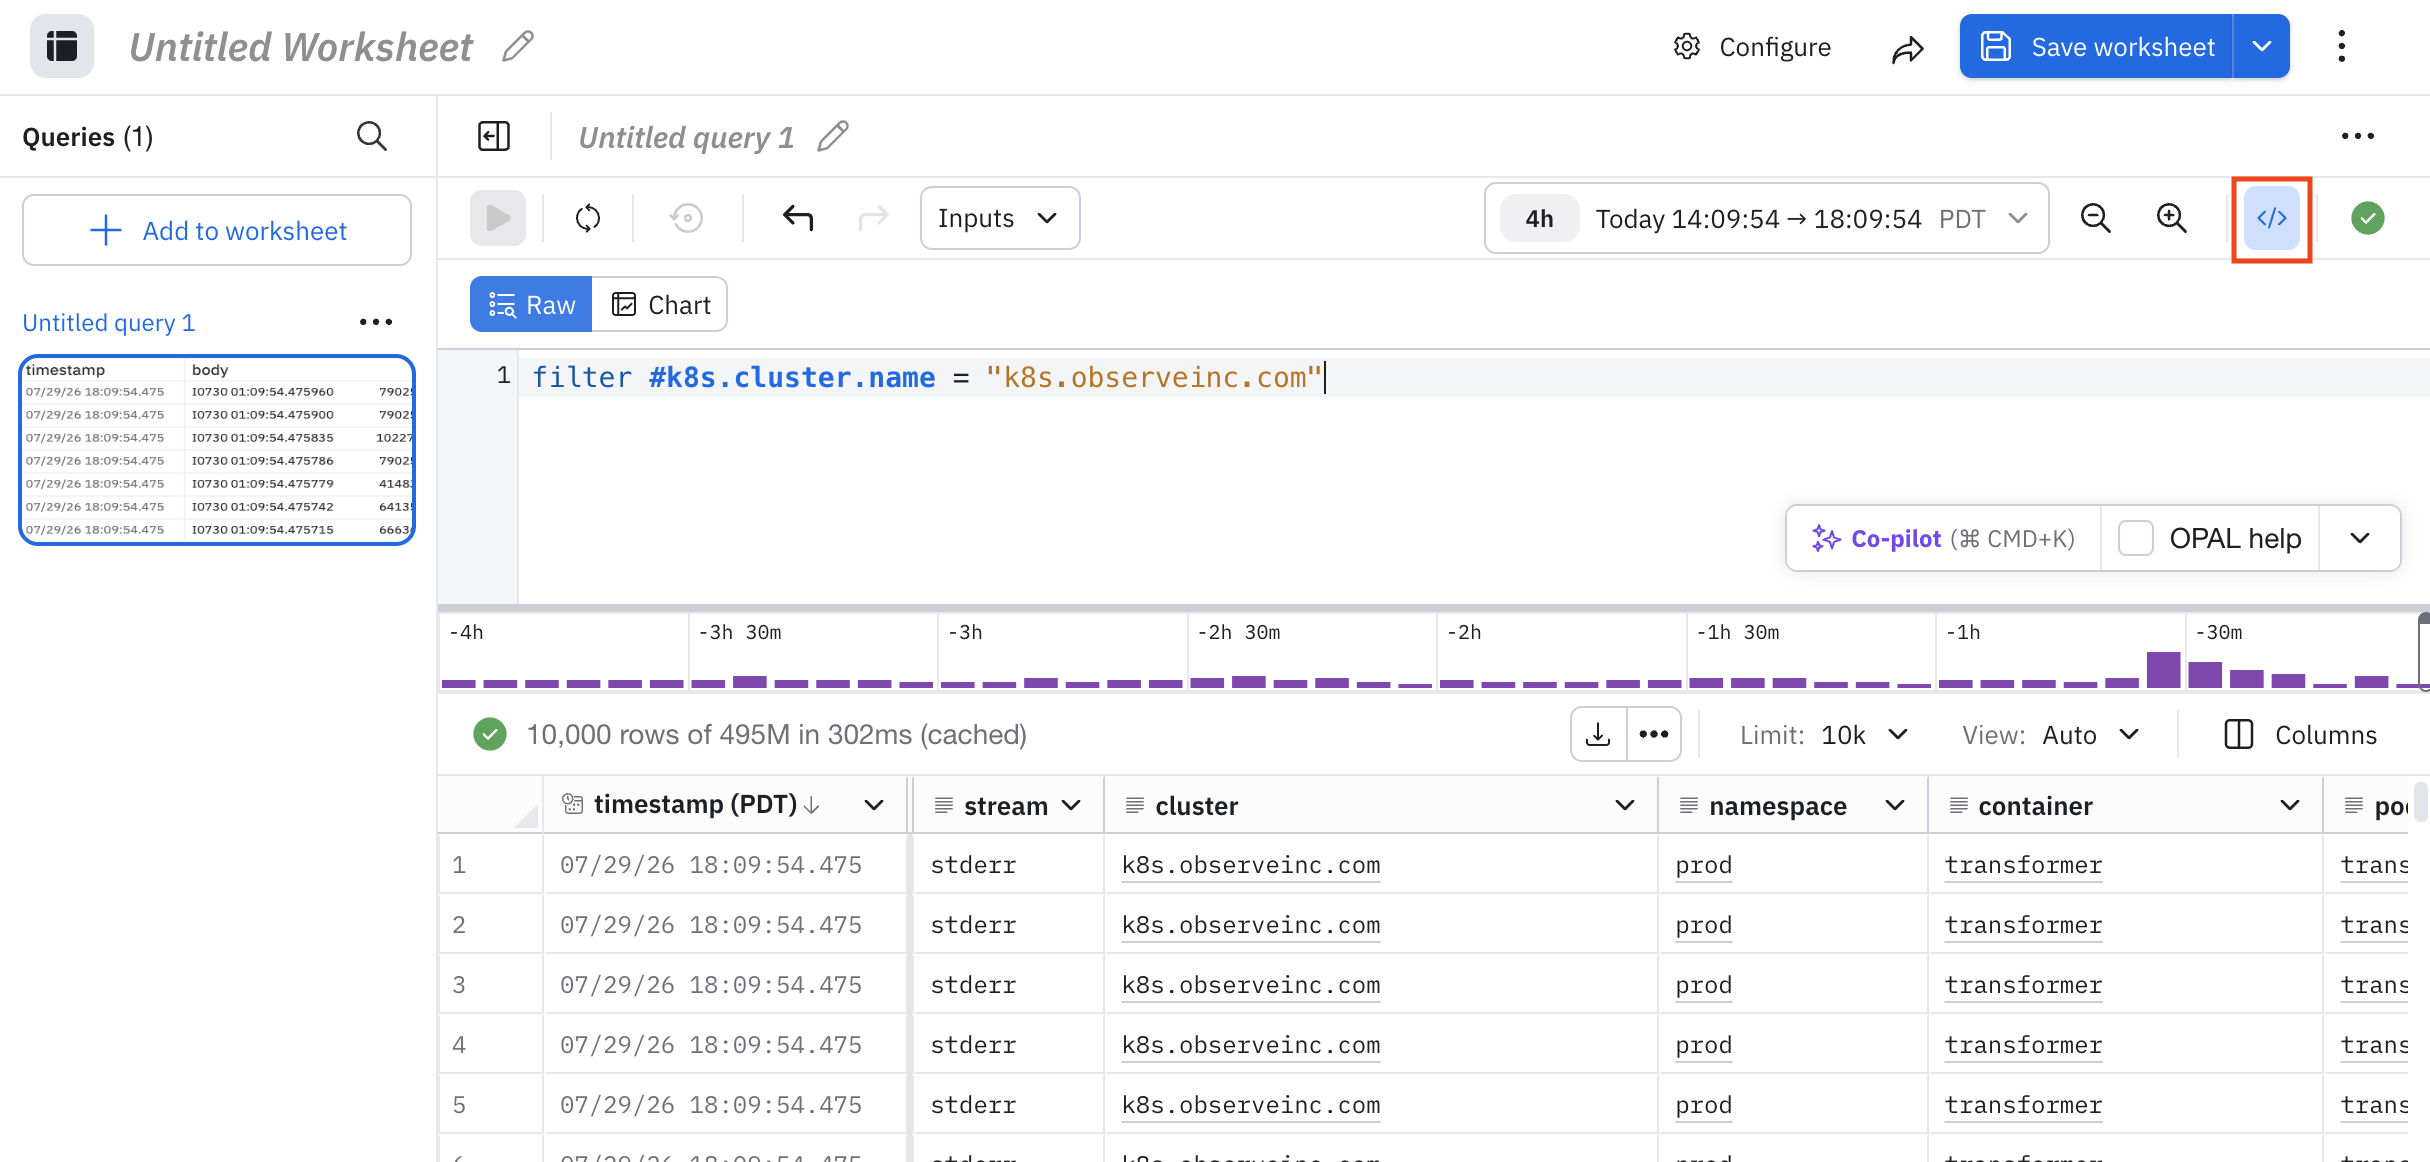
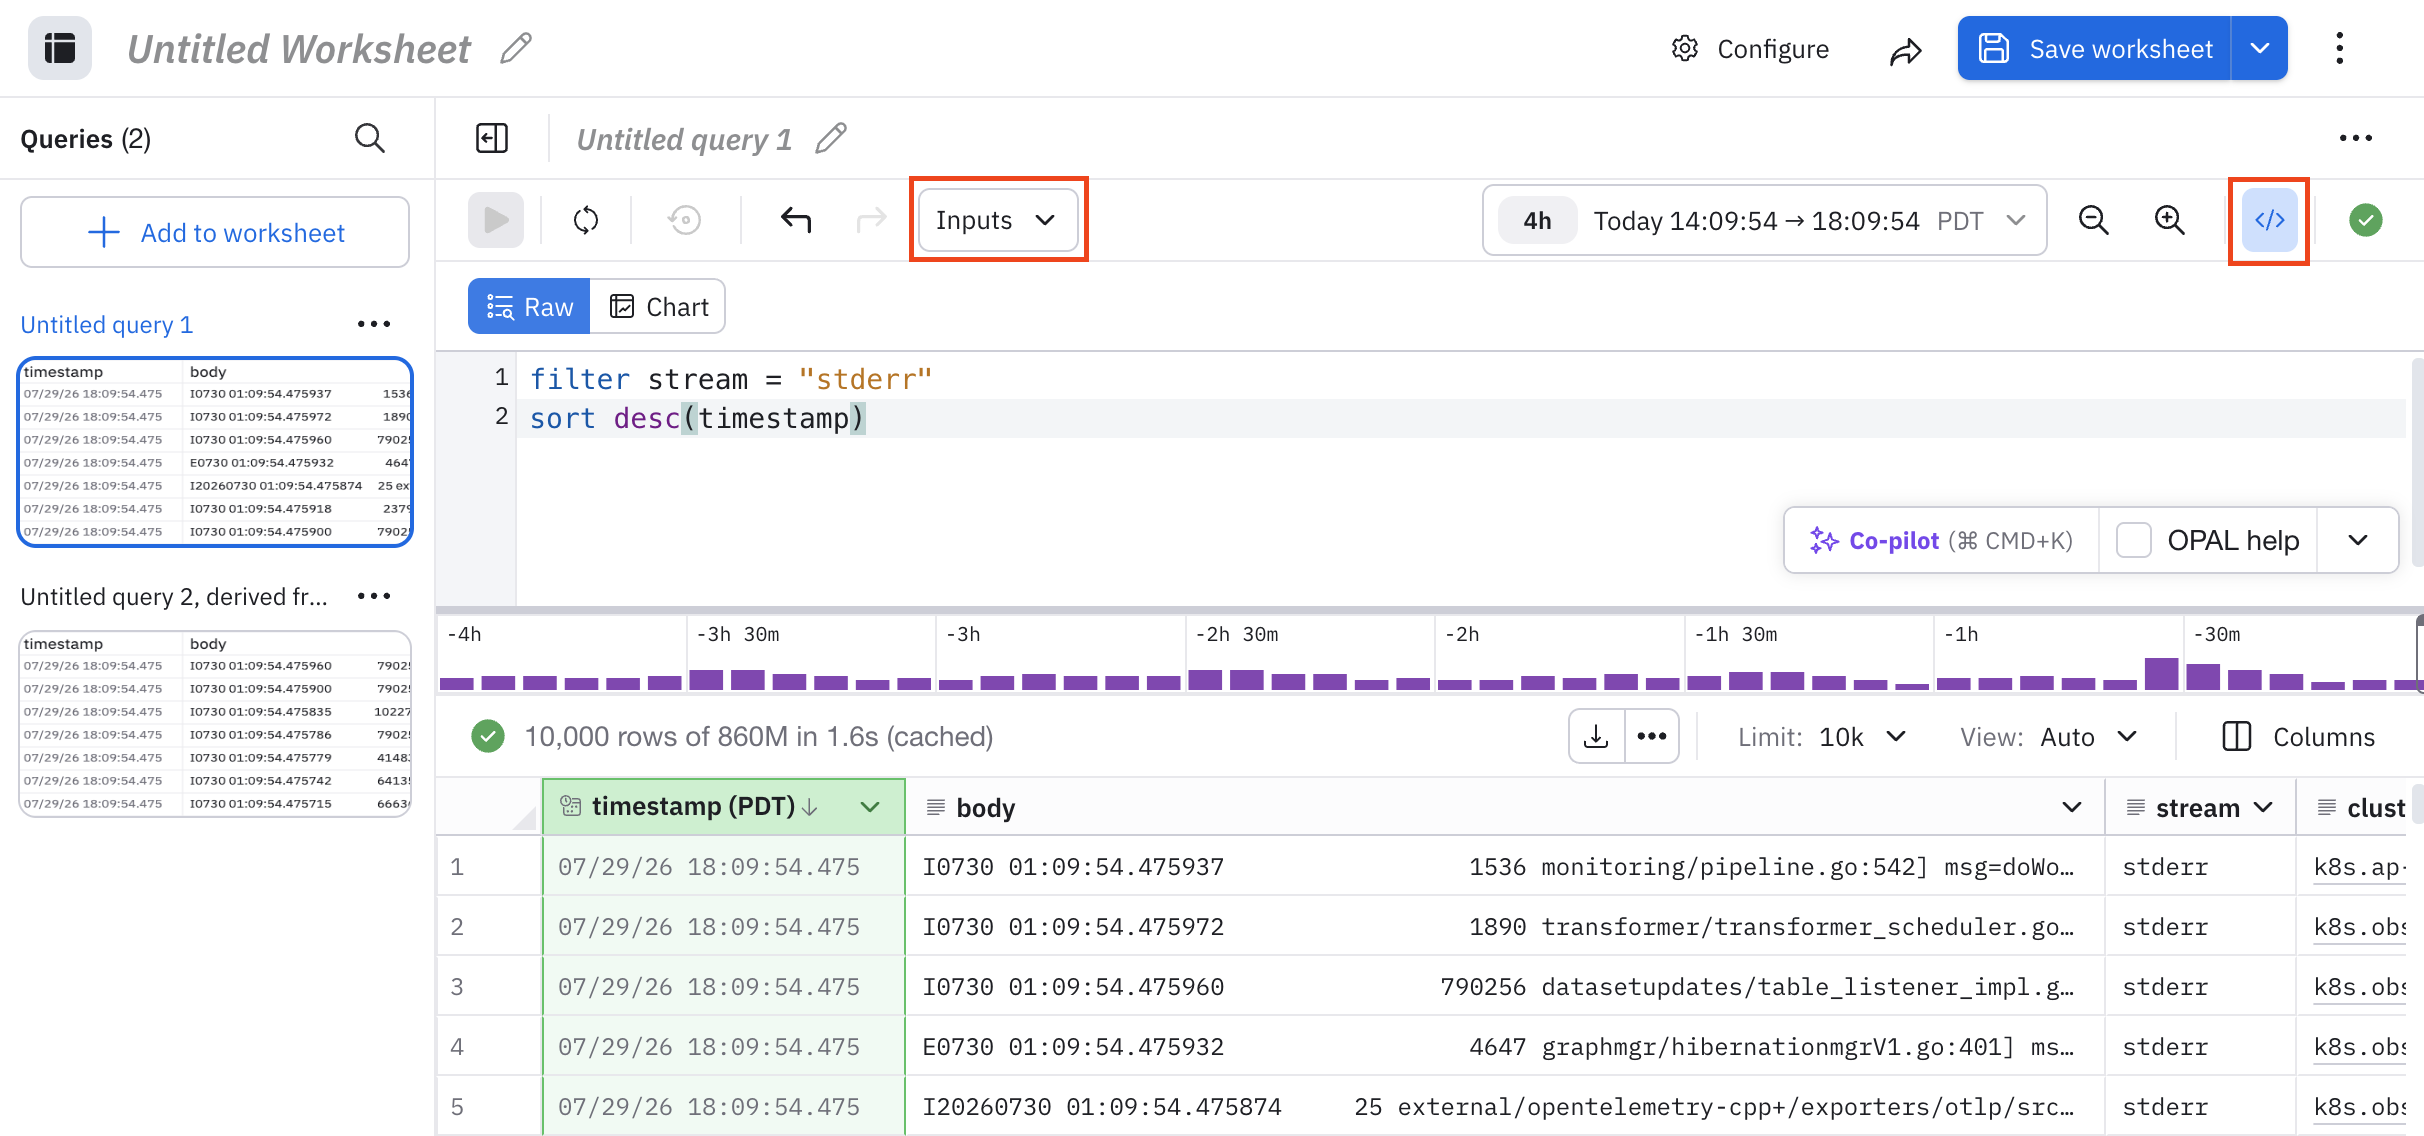
Click the code icon () to view the corresponding OPAL for any query, or if you want to write the query directly in OPAL:
From each query, you can create a derived query, where you pipe one stage’s result into the next, so you can iteratively refine data without leaving the Worksheet.
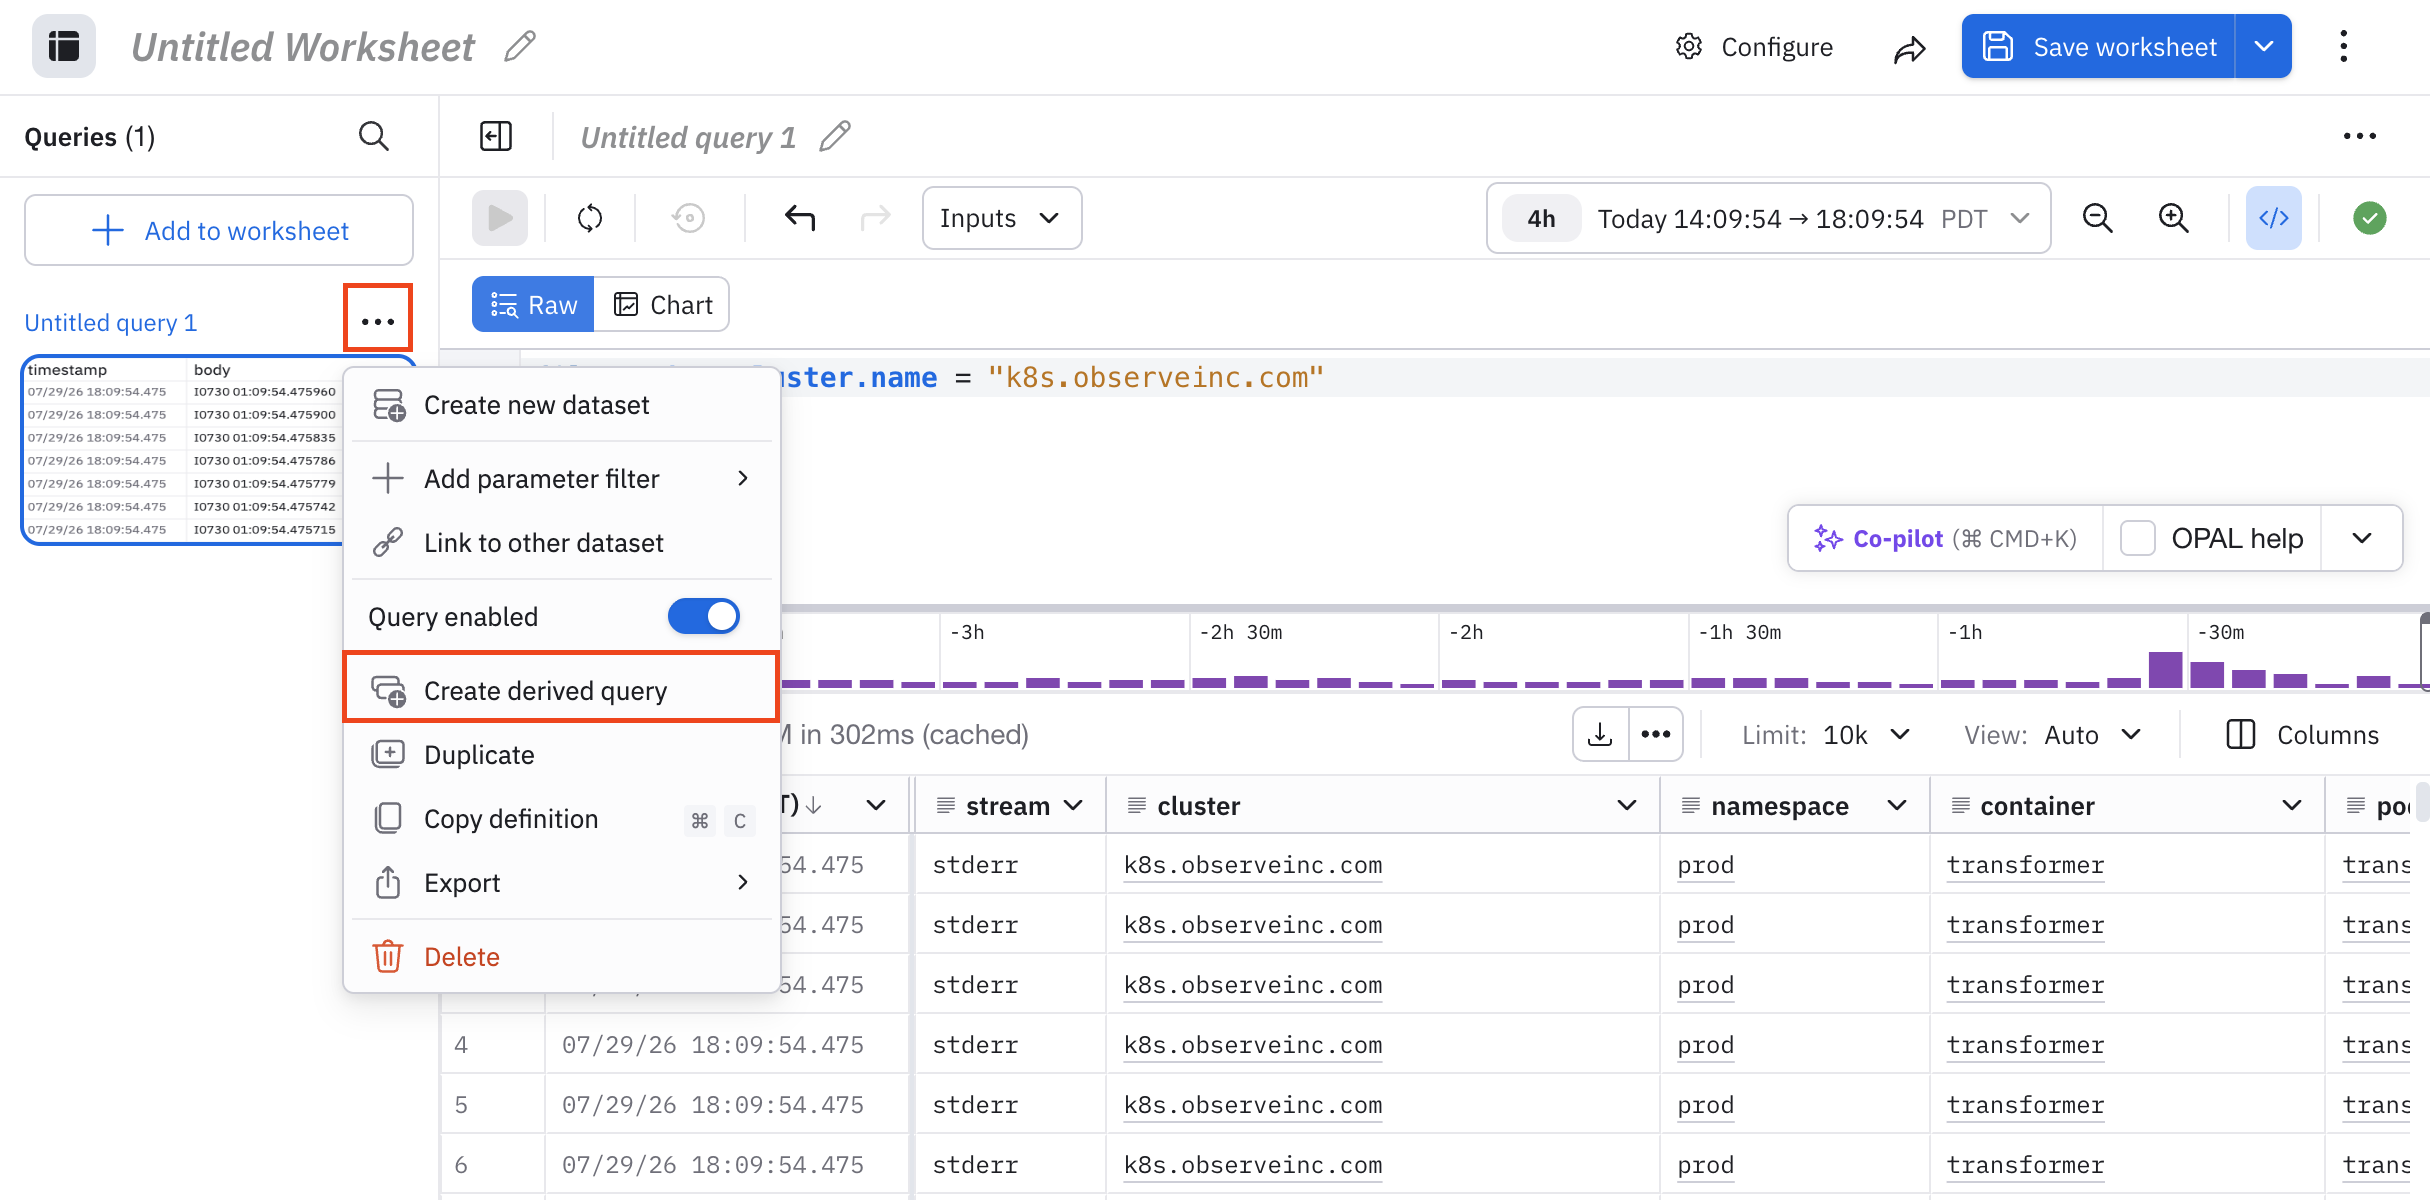
From a query panel, click the ellipsis icon () and select Create derived query:
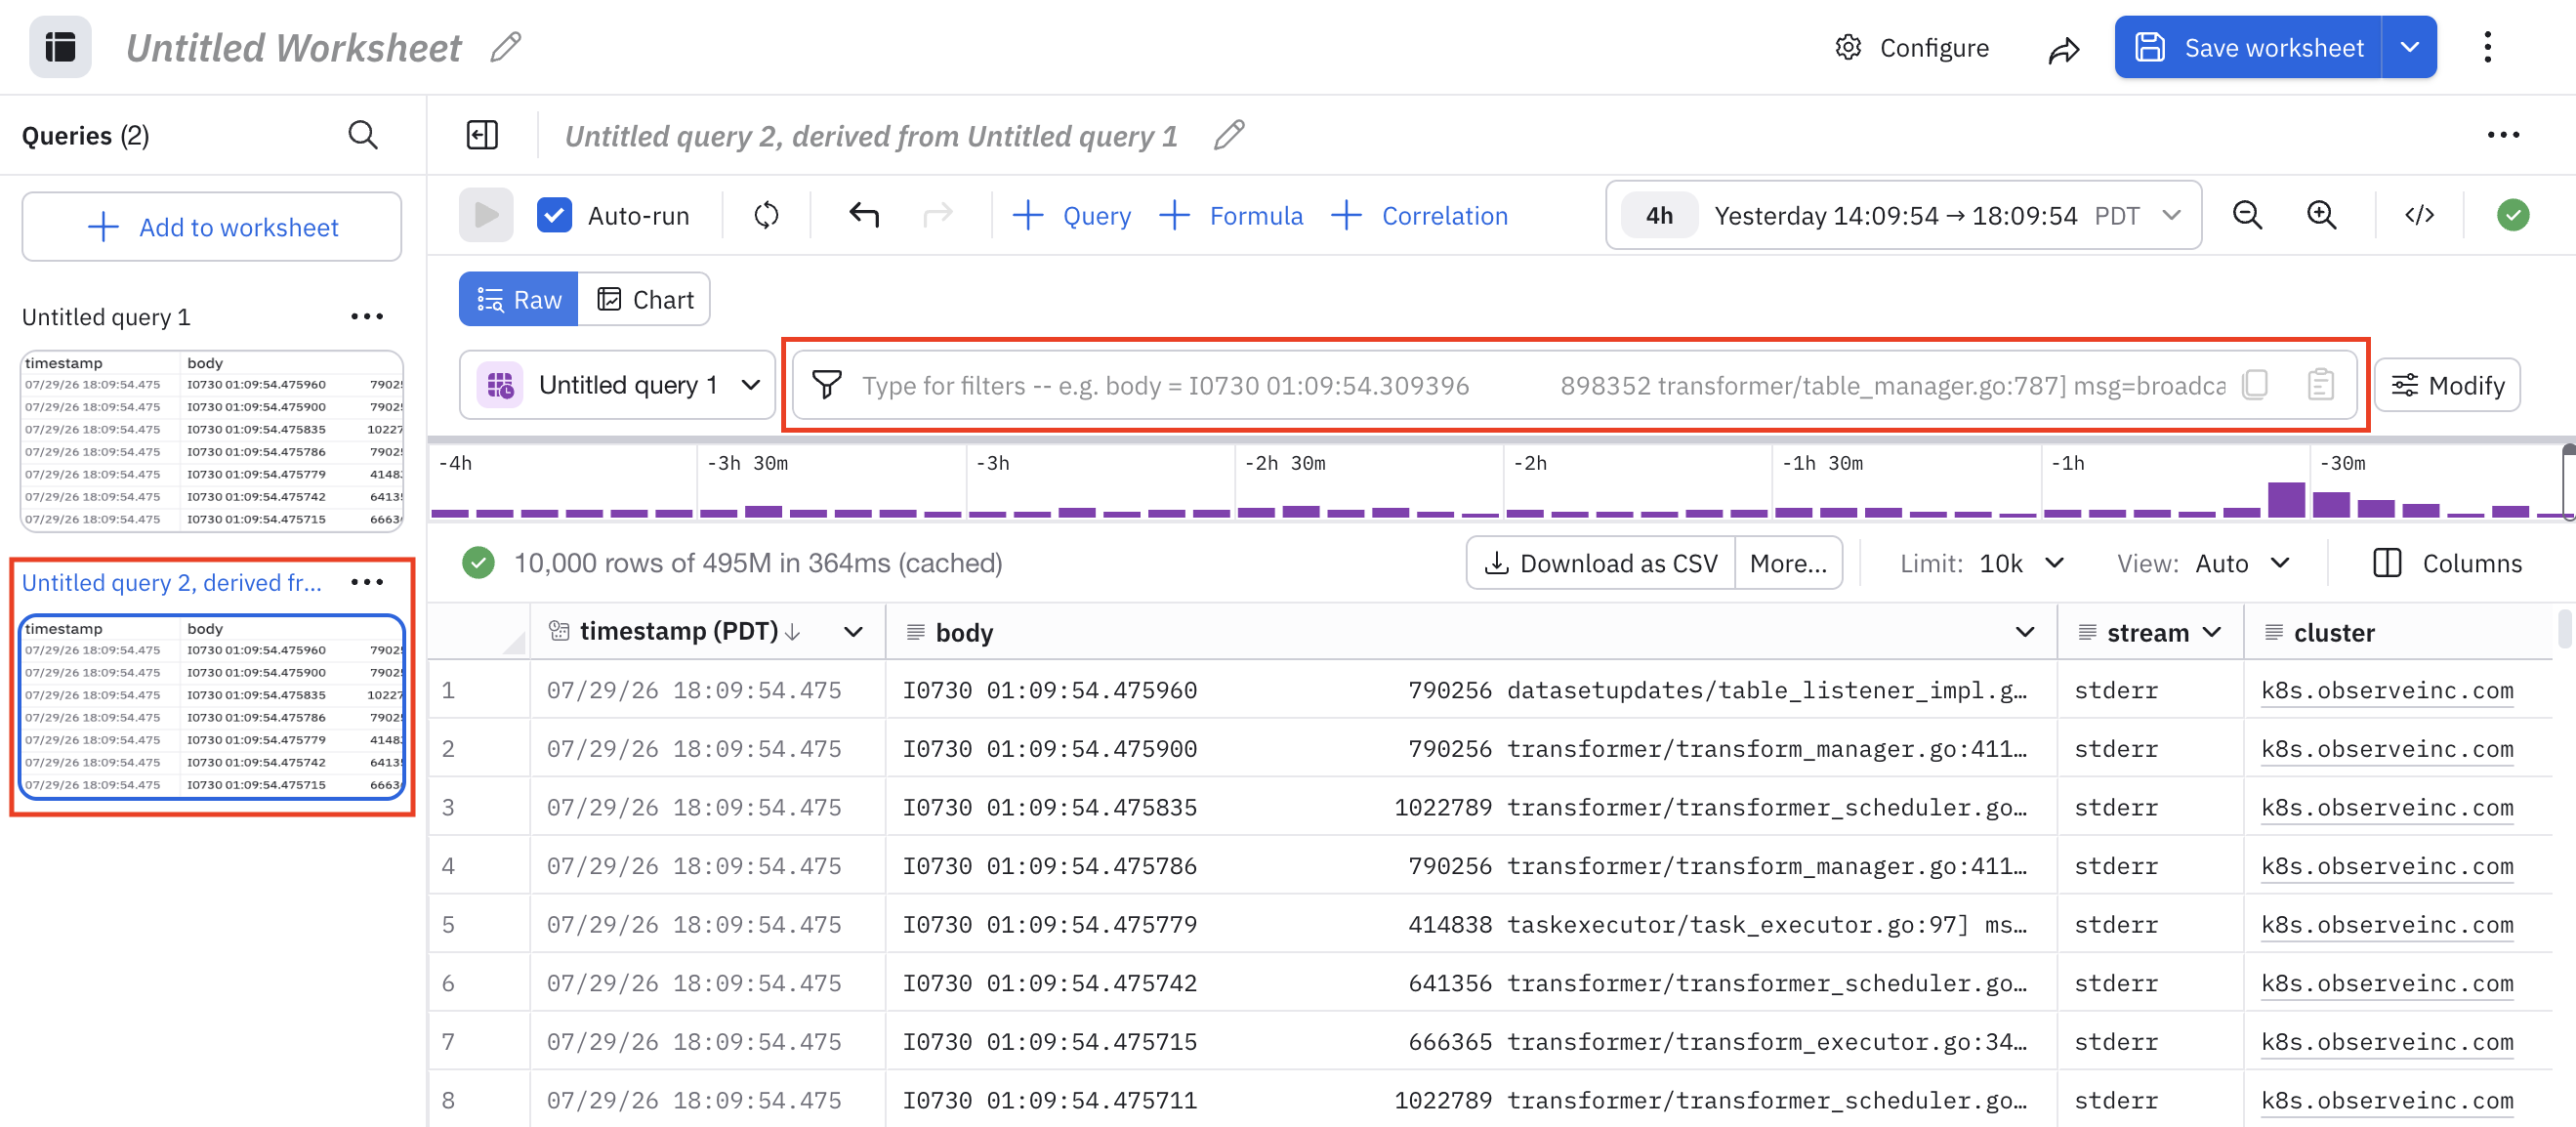
Derived queries take the results from the parent query, so the data is already filtered based on the filters applied in parent query. You won't see the filters in the filter bar in the derived query:
Filter your data using column headers
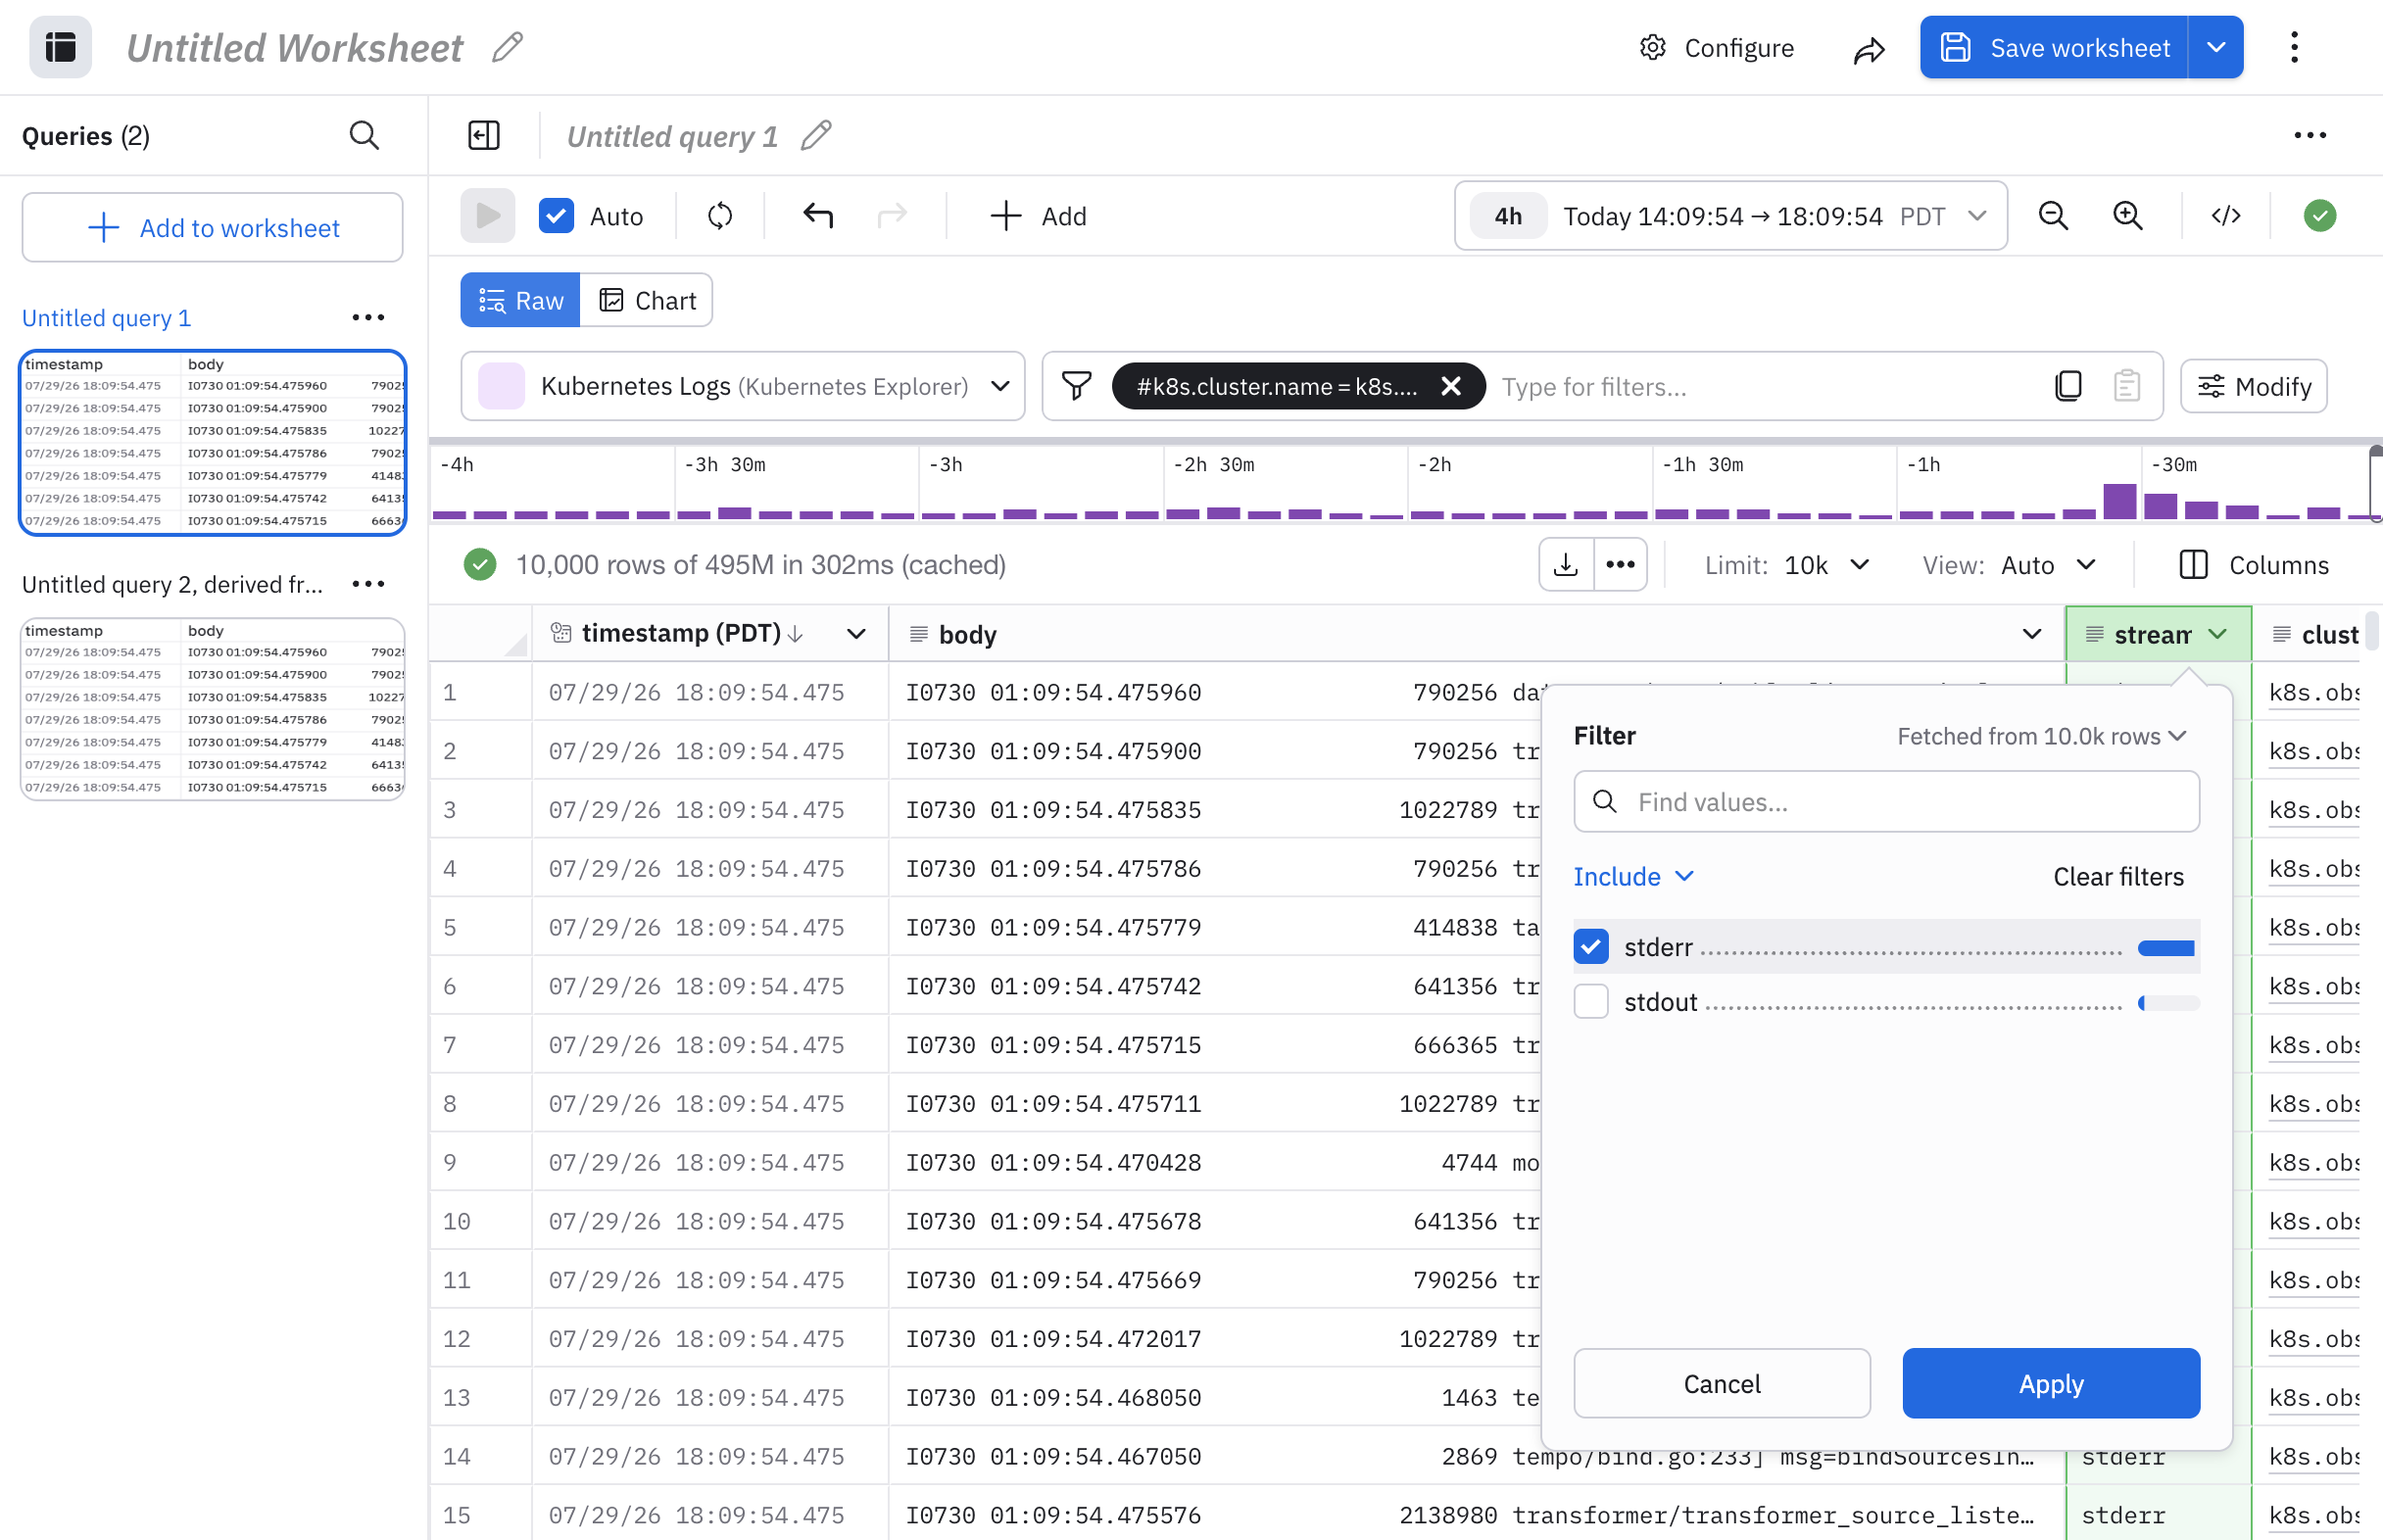
Click the down icon () in each column header to view the column context menu, where you can select options for work with data in a single column. The type of options depends on the data type in the column.
For example, suppose we click on the steam column, and select stderr as the stream:
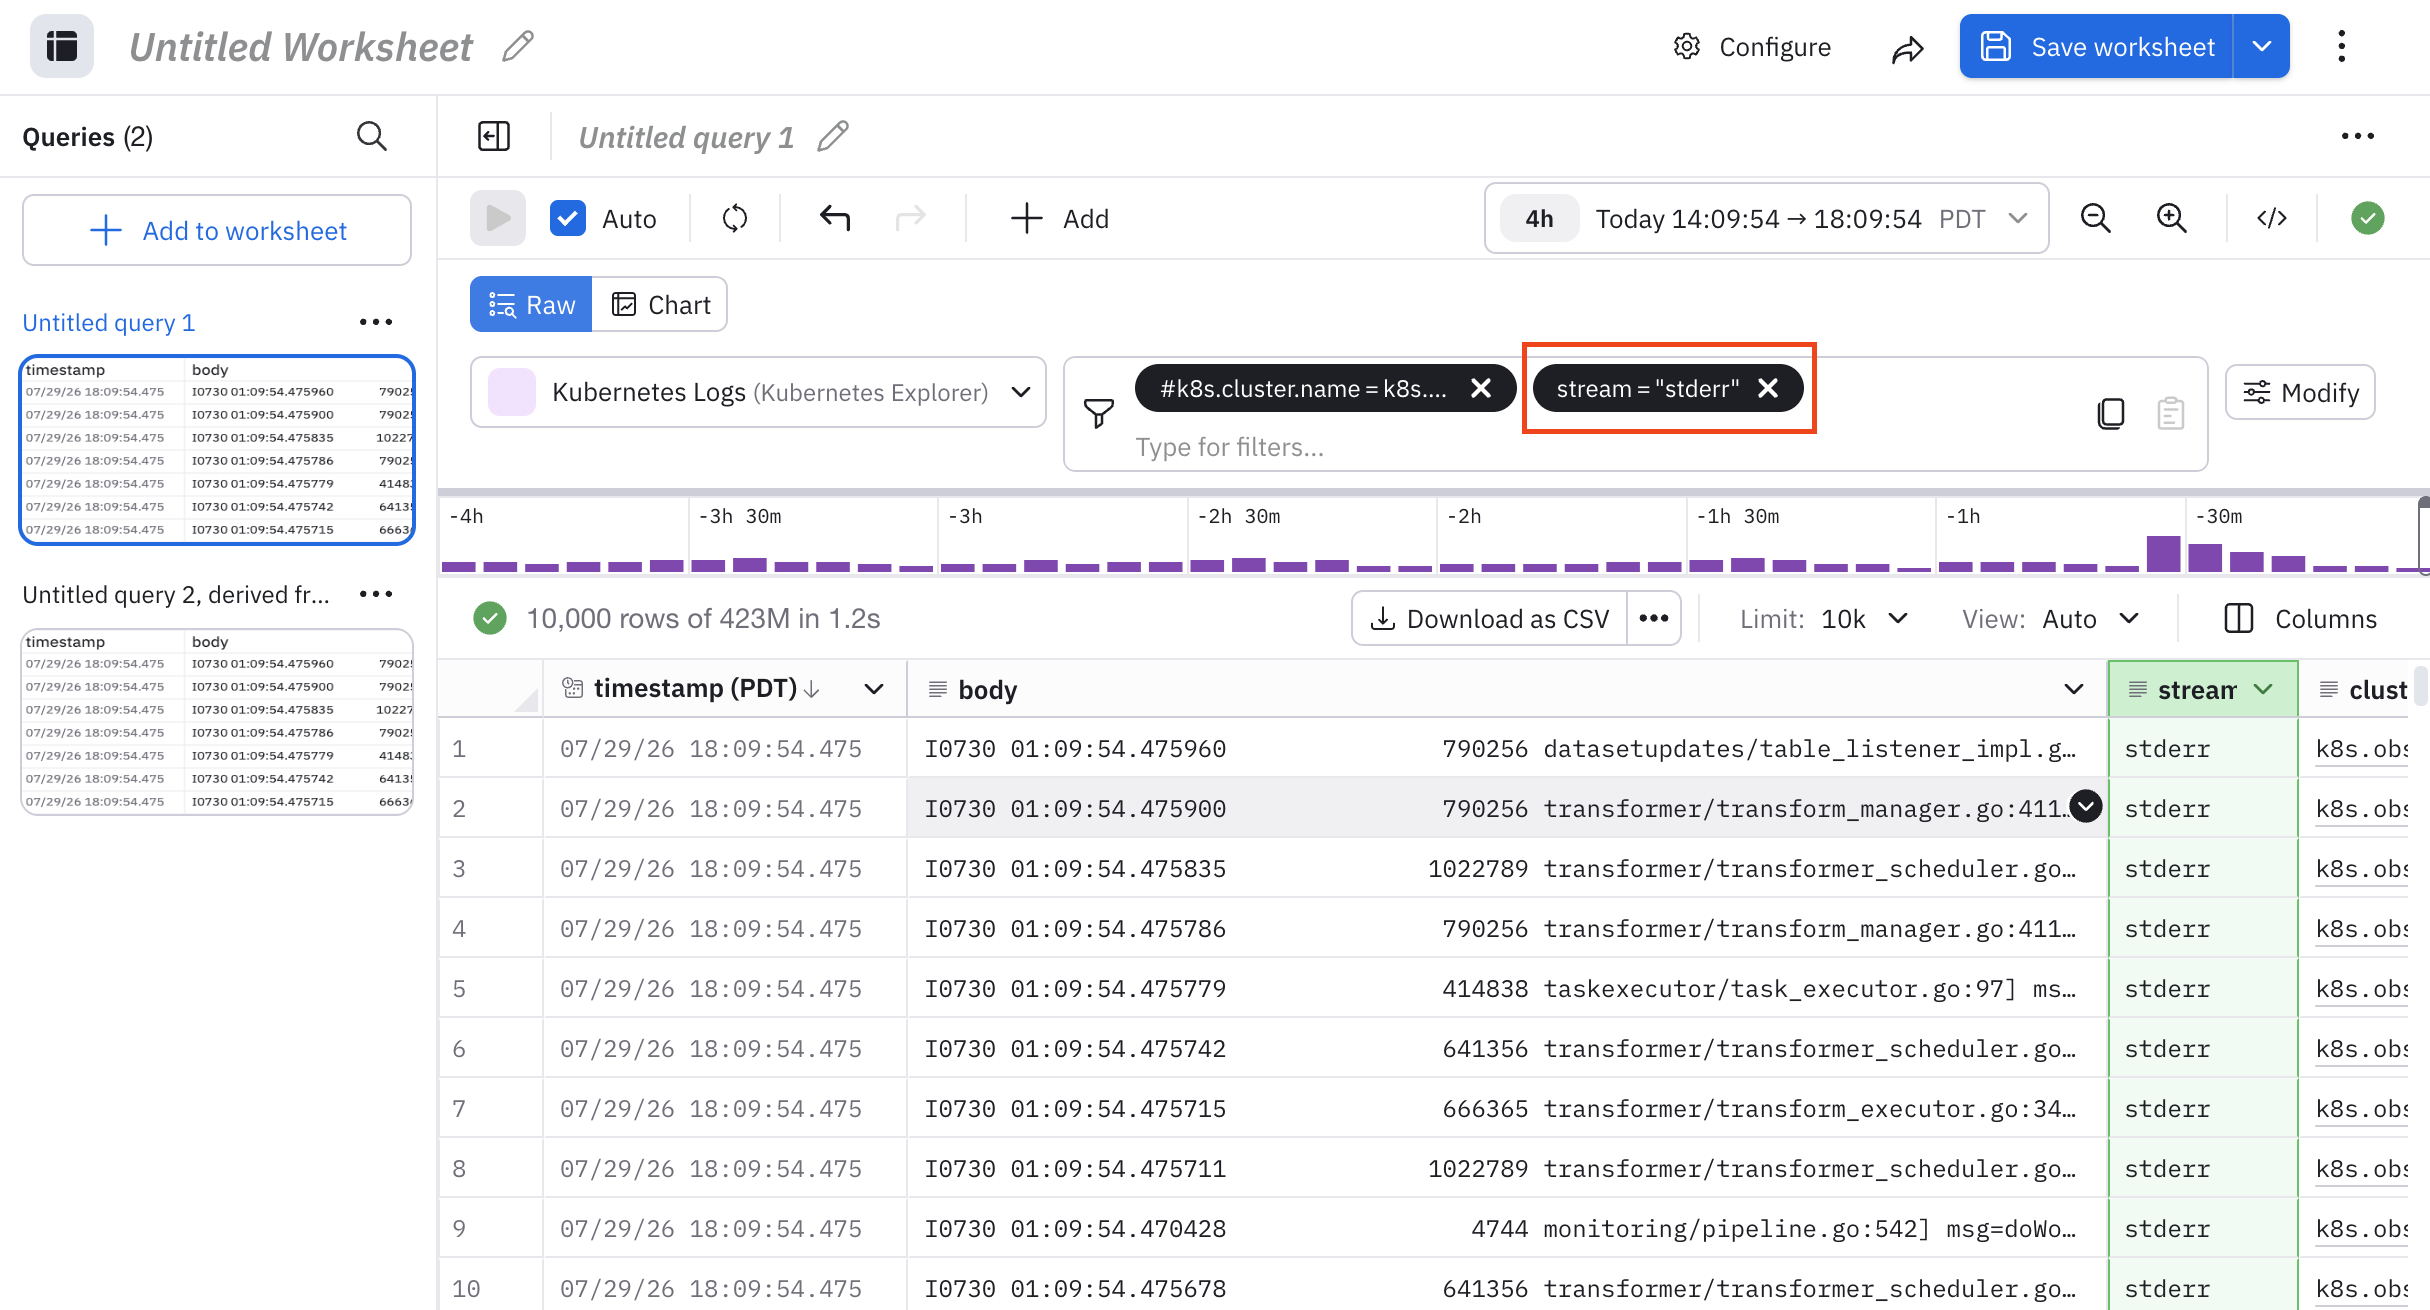
The selection is reflected in the filter bar:
Visualize your data
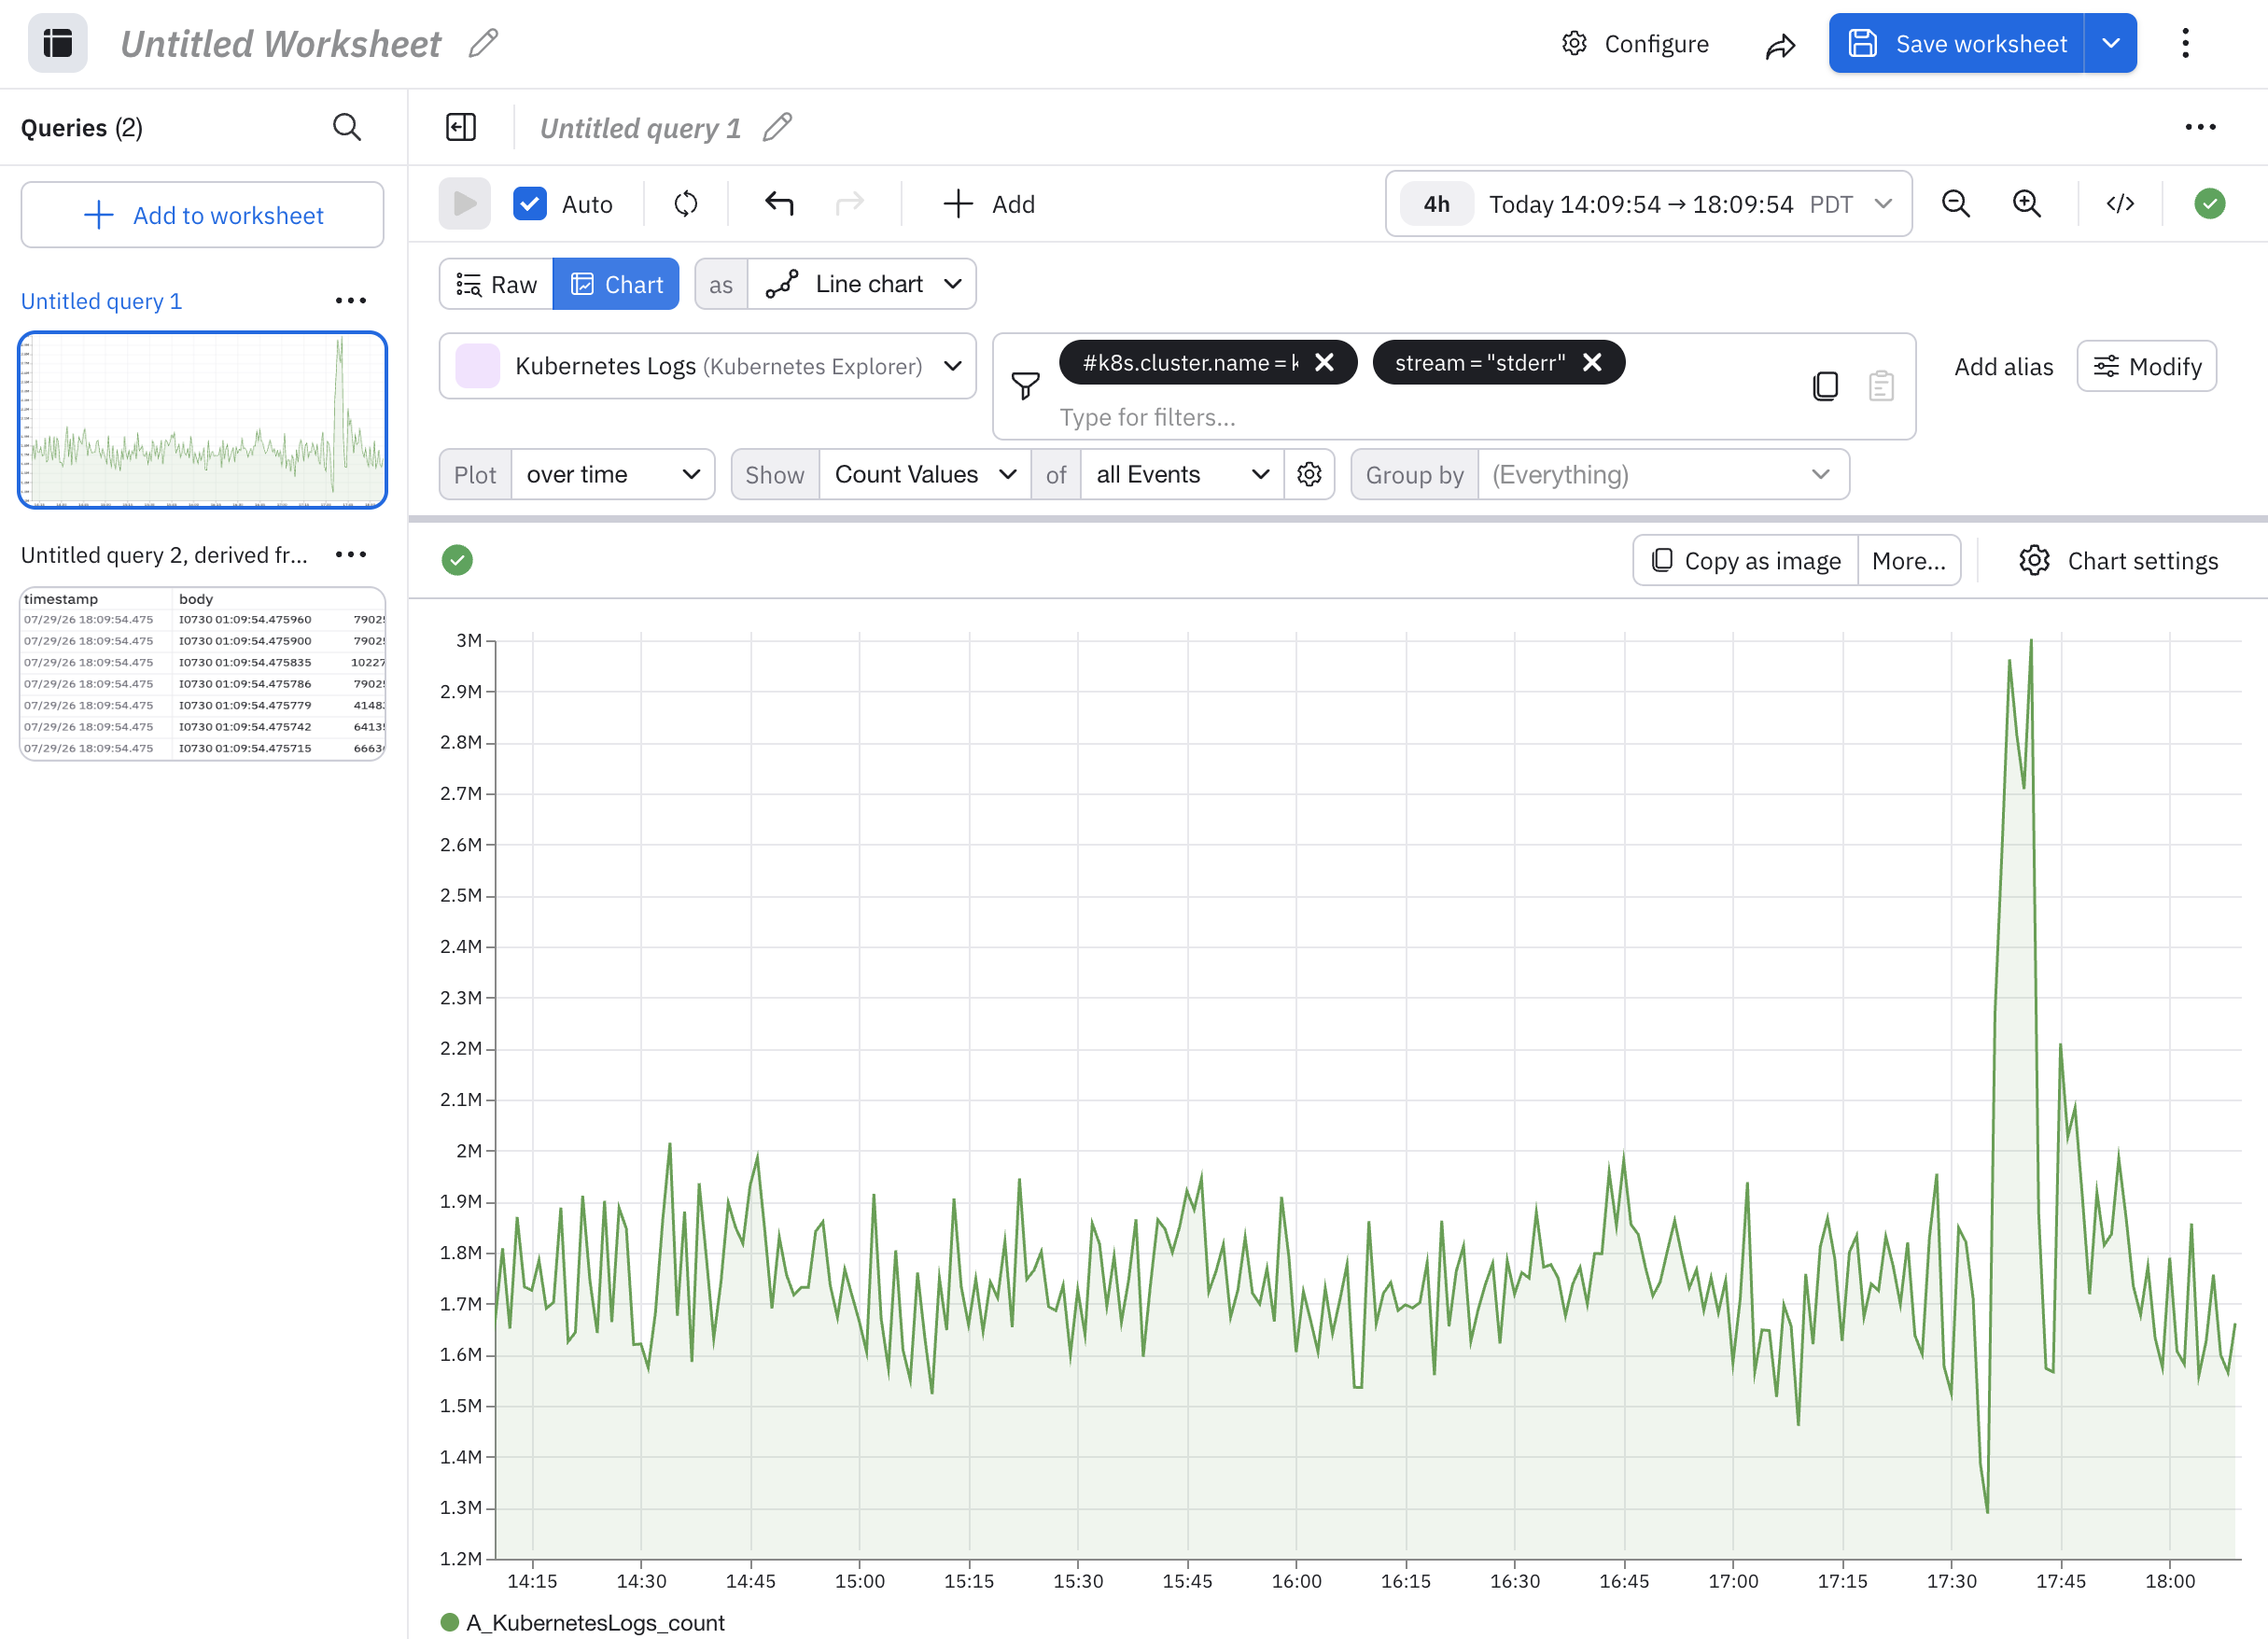
You can easily visualize your data by selecting the Chart option within the expression builder. Try selecting Chart.
We can see a sharp spike in errors between 17:30 and 17:45:
Now that we've found something interesting, we can share our worksheet with our team to continue the investigation. See Export and share Worksheets.
That's the end of this exercise. To learn more about the types of visualizations supported in Observe by Snowflake, see Visualization types.
Share a Worksheet in Observe by Snowflake
Often, when investigating in incident or simply exploring your data, you'll want to share your findings with someone else. To do this, use the share icon (). It's important to use the share icon instead of simply copying the browser URL to ensure you capture the correct state (filters and time) that you intend to share.
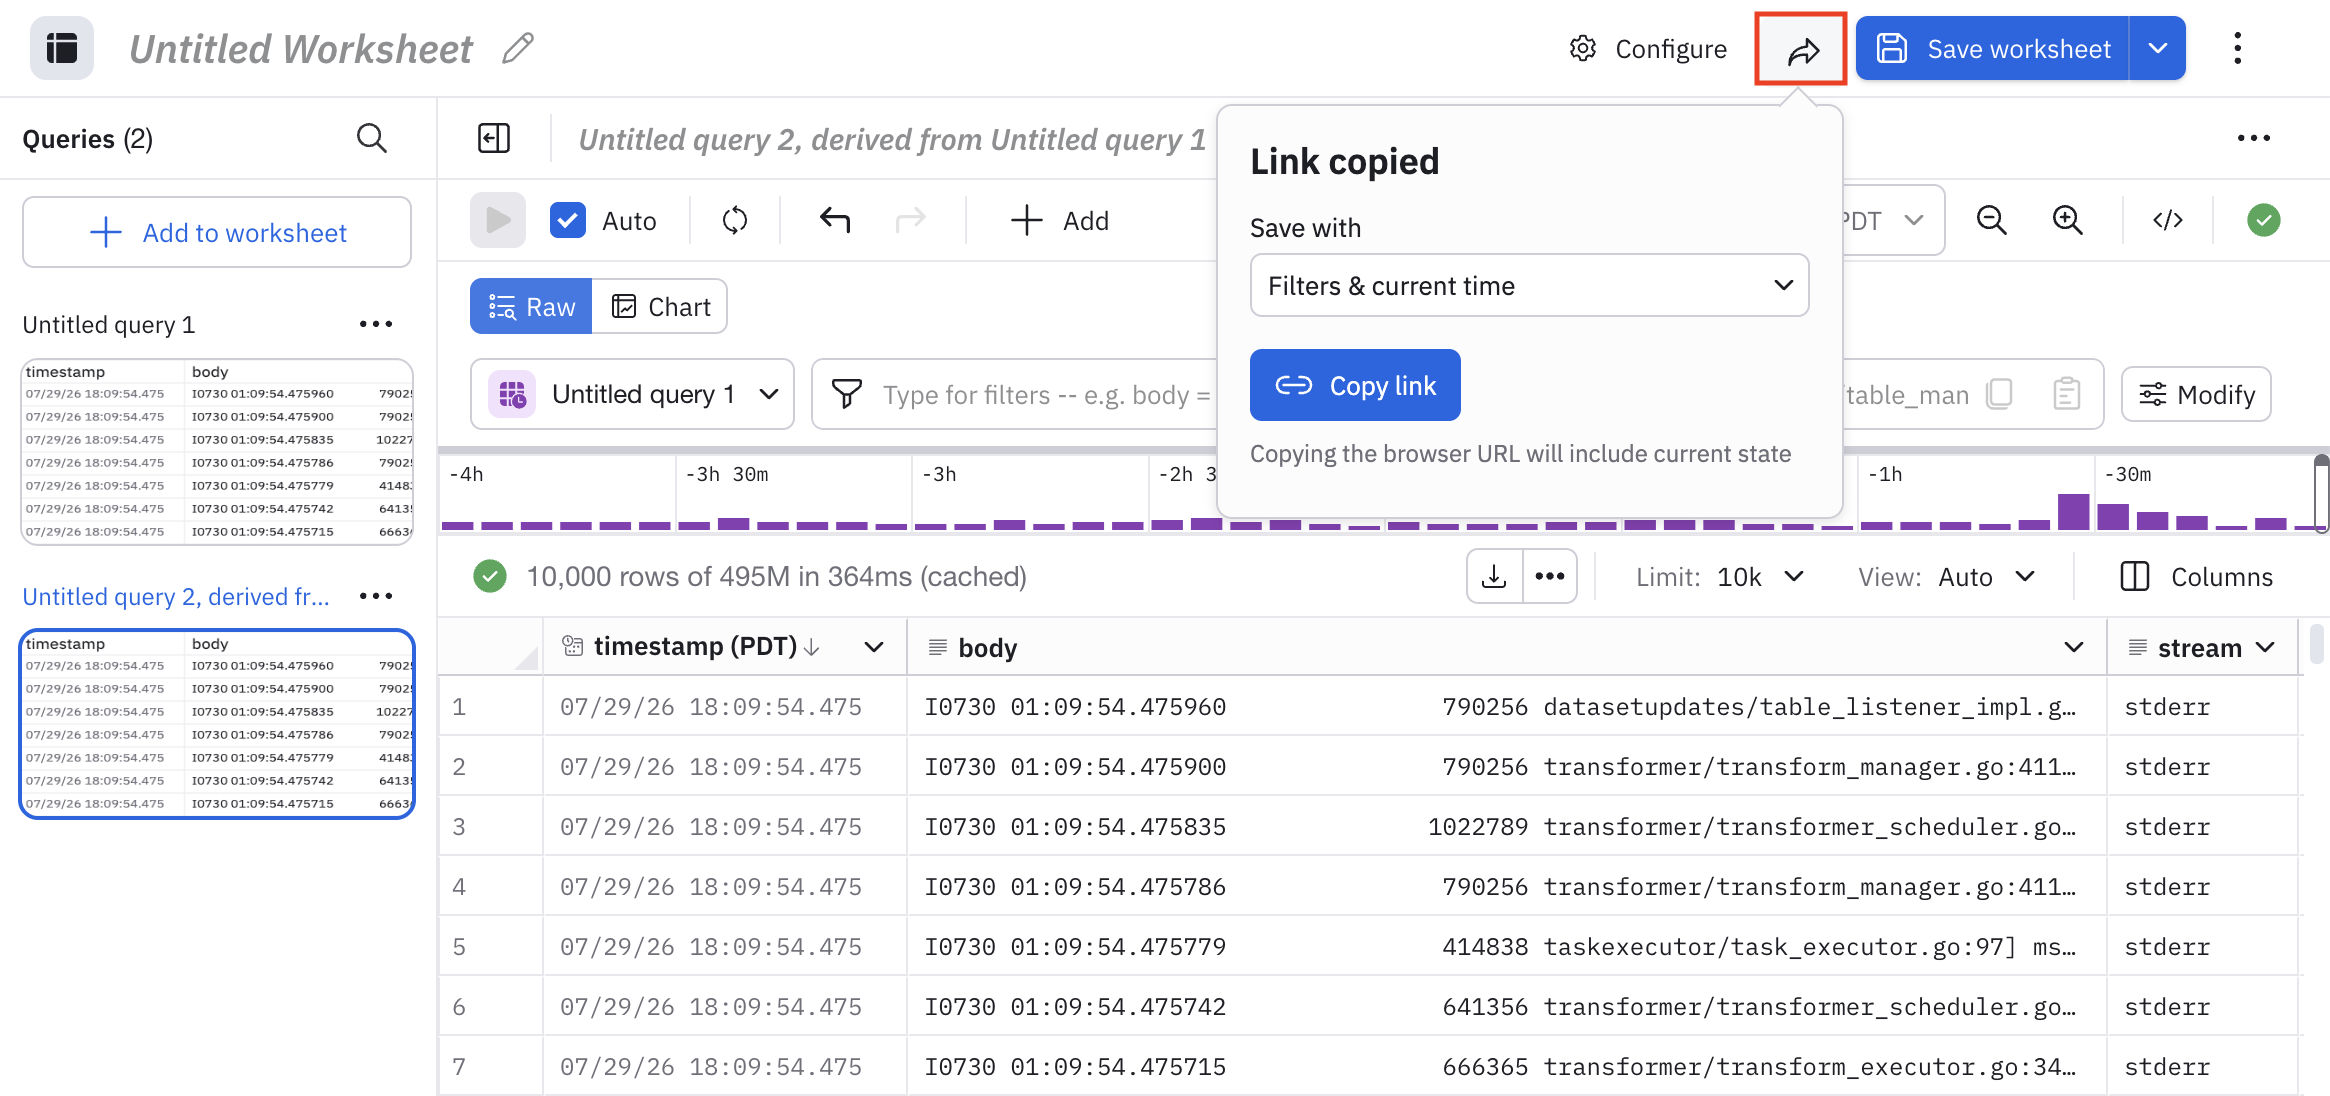
Select the desired Save with option to share your Worksheet with correct state:
- No filters and time - defaults to the saved version of the Worksheet.
- Filter and relative time - displays current filters with data in the relative timeframe in the Select Time Frame menu.
- Filters and current time - displays the latest version based on the current time.
Click Copy Link to copy the link to your clipboard and then provide the link to another Observe by Snowflake user.
You can also share or export a Worksheet after you have saved it. See Export and share Worksheets for more information.
More options in the column context menu
Earlier, we used the column context menu to add a filter to our data. The column context menu contains a variety of options beyond just filtering, depending on the data type:
| Option | Description |
|---|---|
| FIlter | Filter data by a single field. |
| Remove empty cells | Remove empty cells from the column. |
| Create as visualization | Create a visual representation of data in a column. |
| Extract from string | Extract parameters depending on the type of string. |
| Sort A -> Z | Sort the data in ascending order. For example, text starting with "a" at the top of the table. |
| Sort Z -> A | Sort the data in descending order. For example, text starting with "z" at the top of the table. |
| Sort Earlier > Later | Sort time data by putting the most recent events at the bottom. |
| Sort Later > Earlier | Sort time data by putting the most recent events at the top. |
| Hide column | Hide the column from view. |
| Convert | Convert the data in the column to one of the following:
|
| Add parameters | Add or create new parameters:
|
Some columns allow you to extract JSON from the data. Use this to create additional columns of data. In this worksheet, selecting Extract from JSON on the parameter column displays a list of fields that you can select and create columns. You can click Preview to see what your extraction displays as columns. Click Cancel to exit the Extract from JSON option.
Inspect raw data for Worksheet inputs
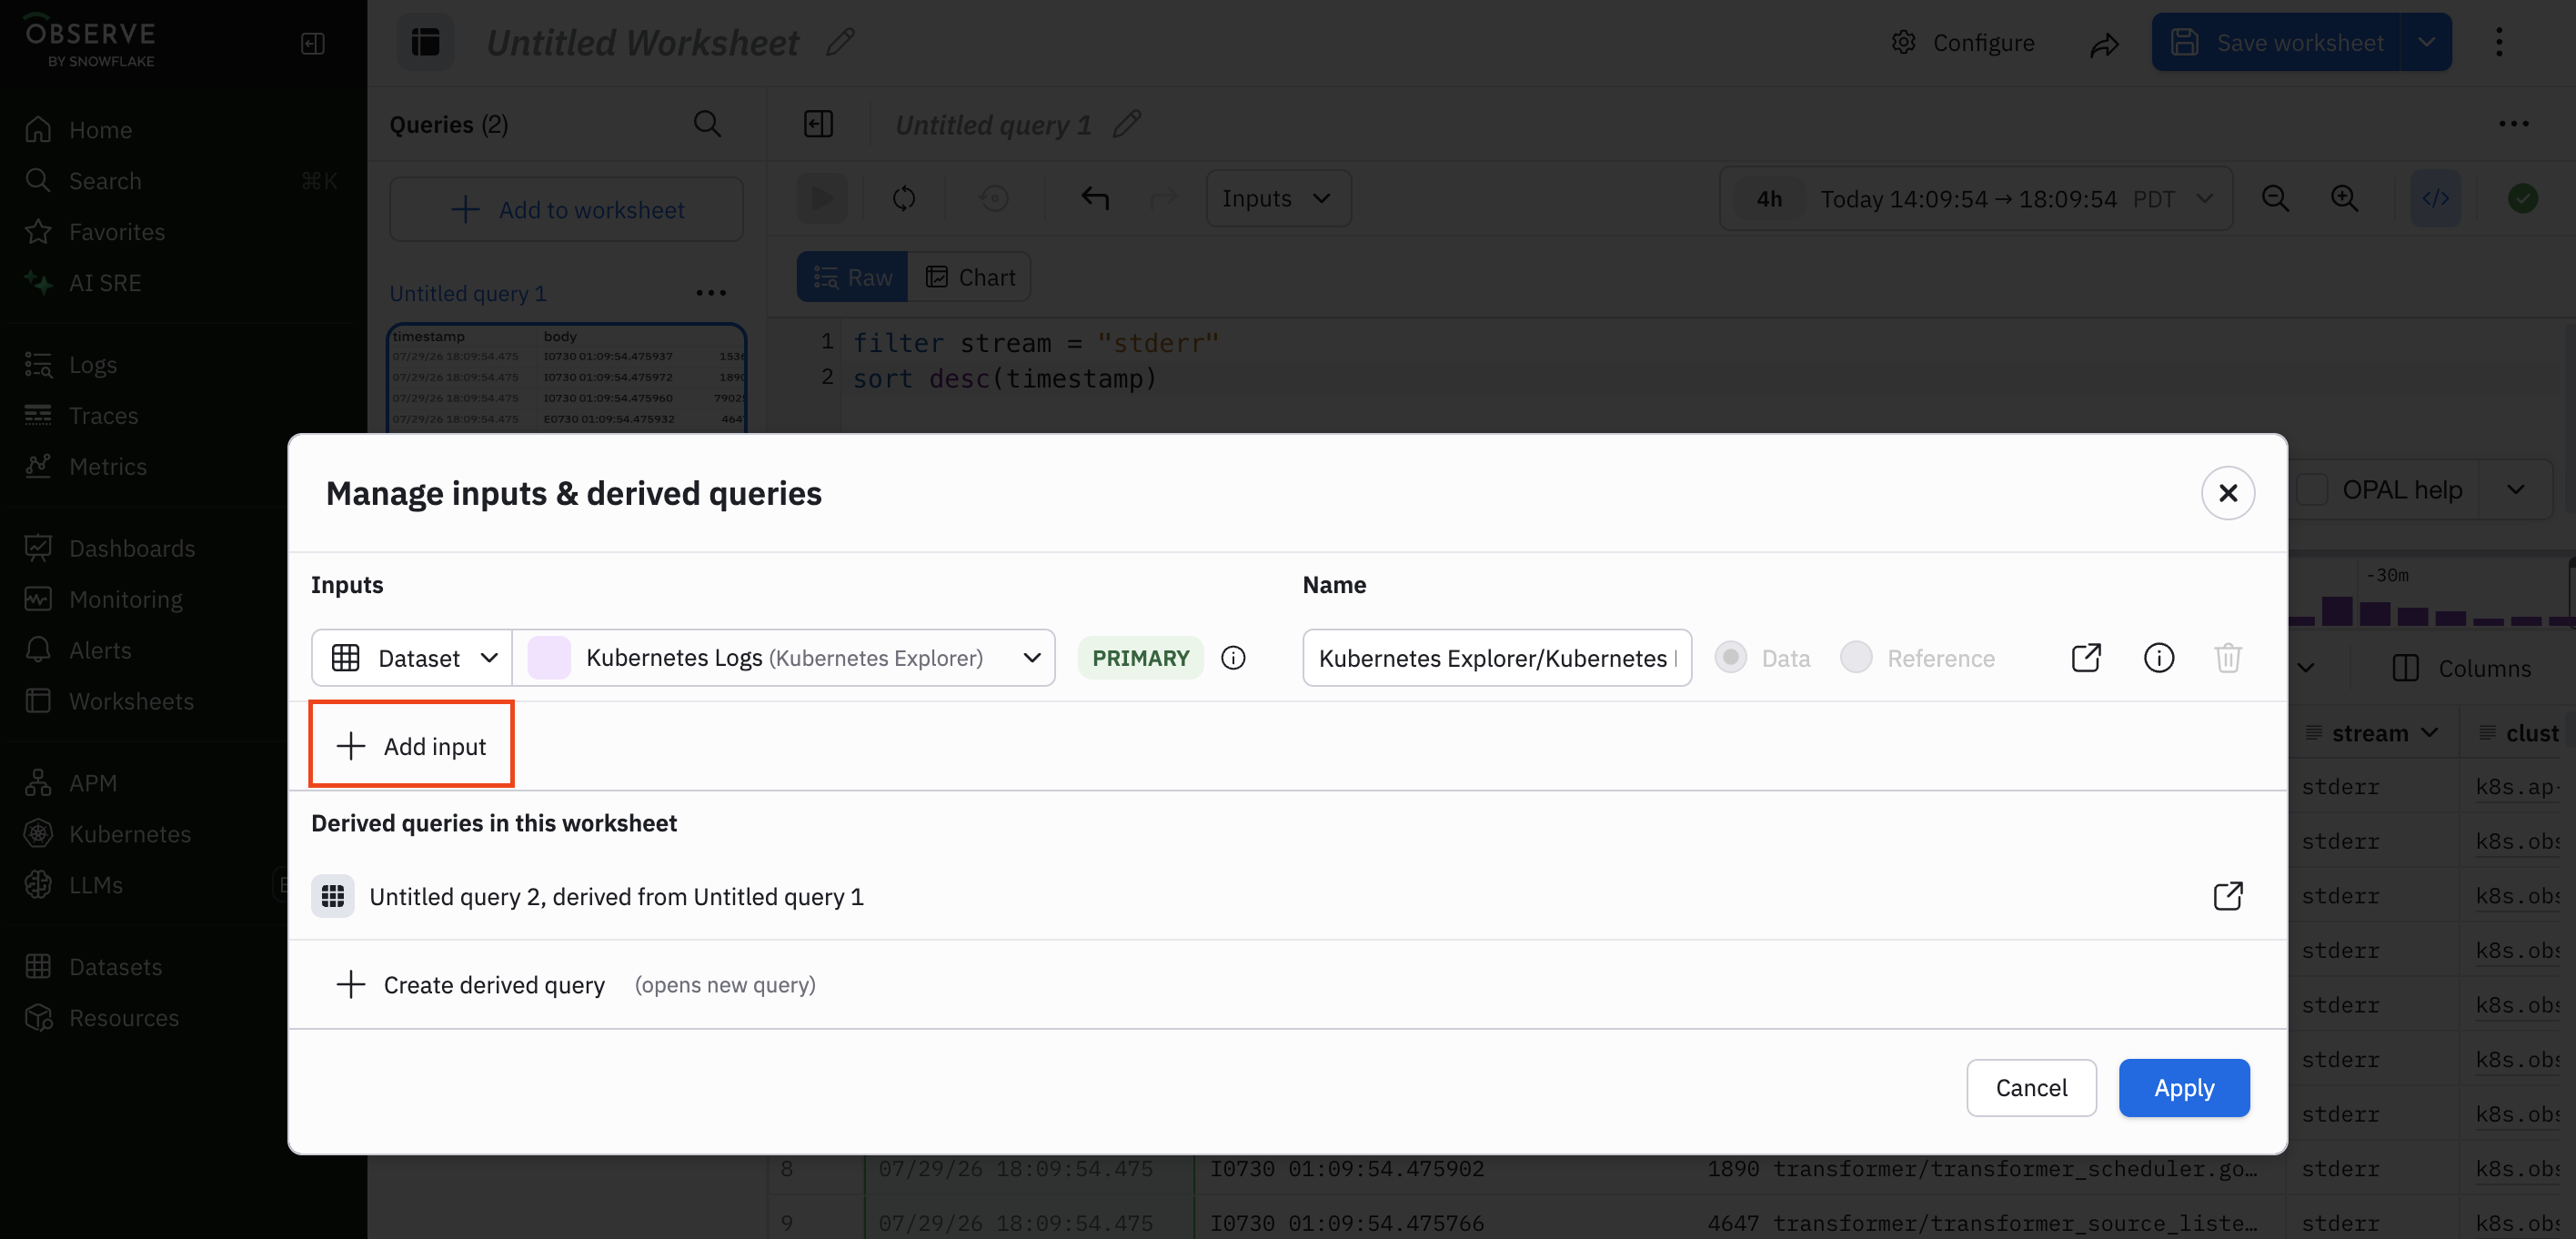
Sometimes, you might want to open up an input to one of your Worksheet to inspect the raw data. You can inspect your inputs via the Inputs button under the OPAL tab:
From this view of your inputs, you can add additional inputs, or you can open any given input in a new tab to inspect the raw data for that input.
Disable queries
If you have a long running or expensive query, you may occasionally want to disable the query from running, but still be able to modify the OPAL while it's in a working state. You can disable a query by using the ellipsis icon () on the query in the left hand rail:
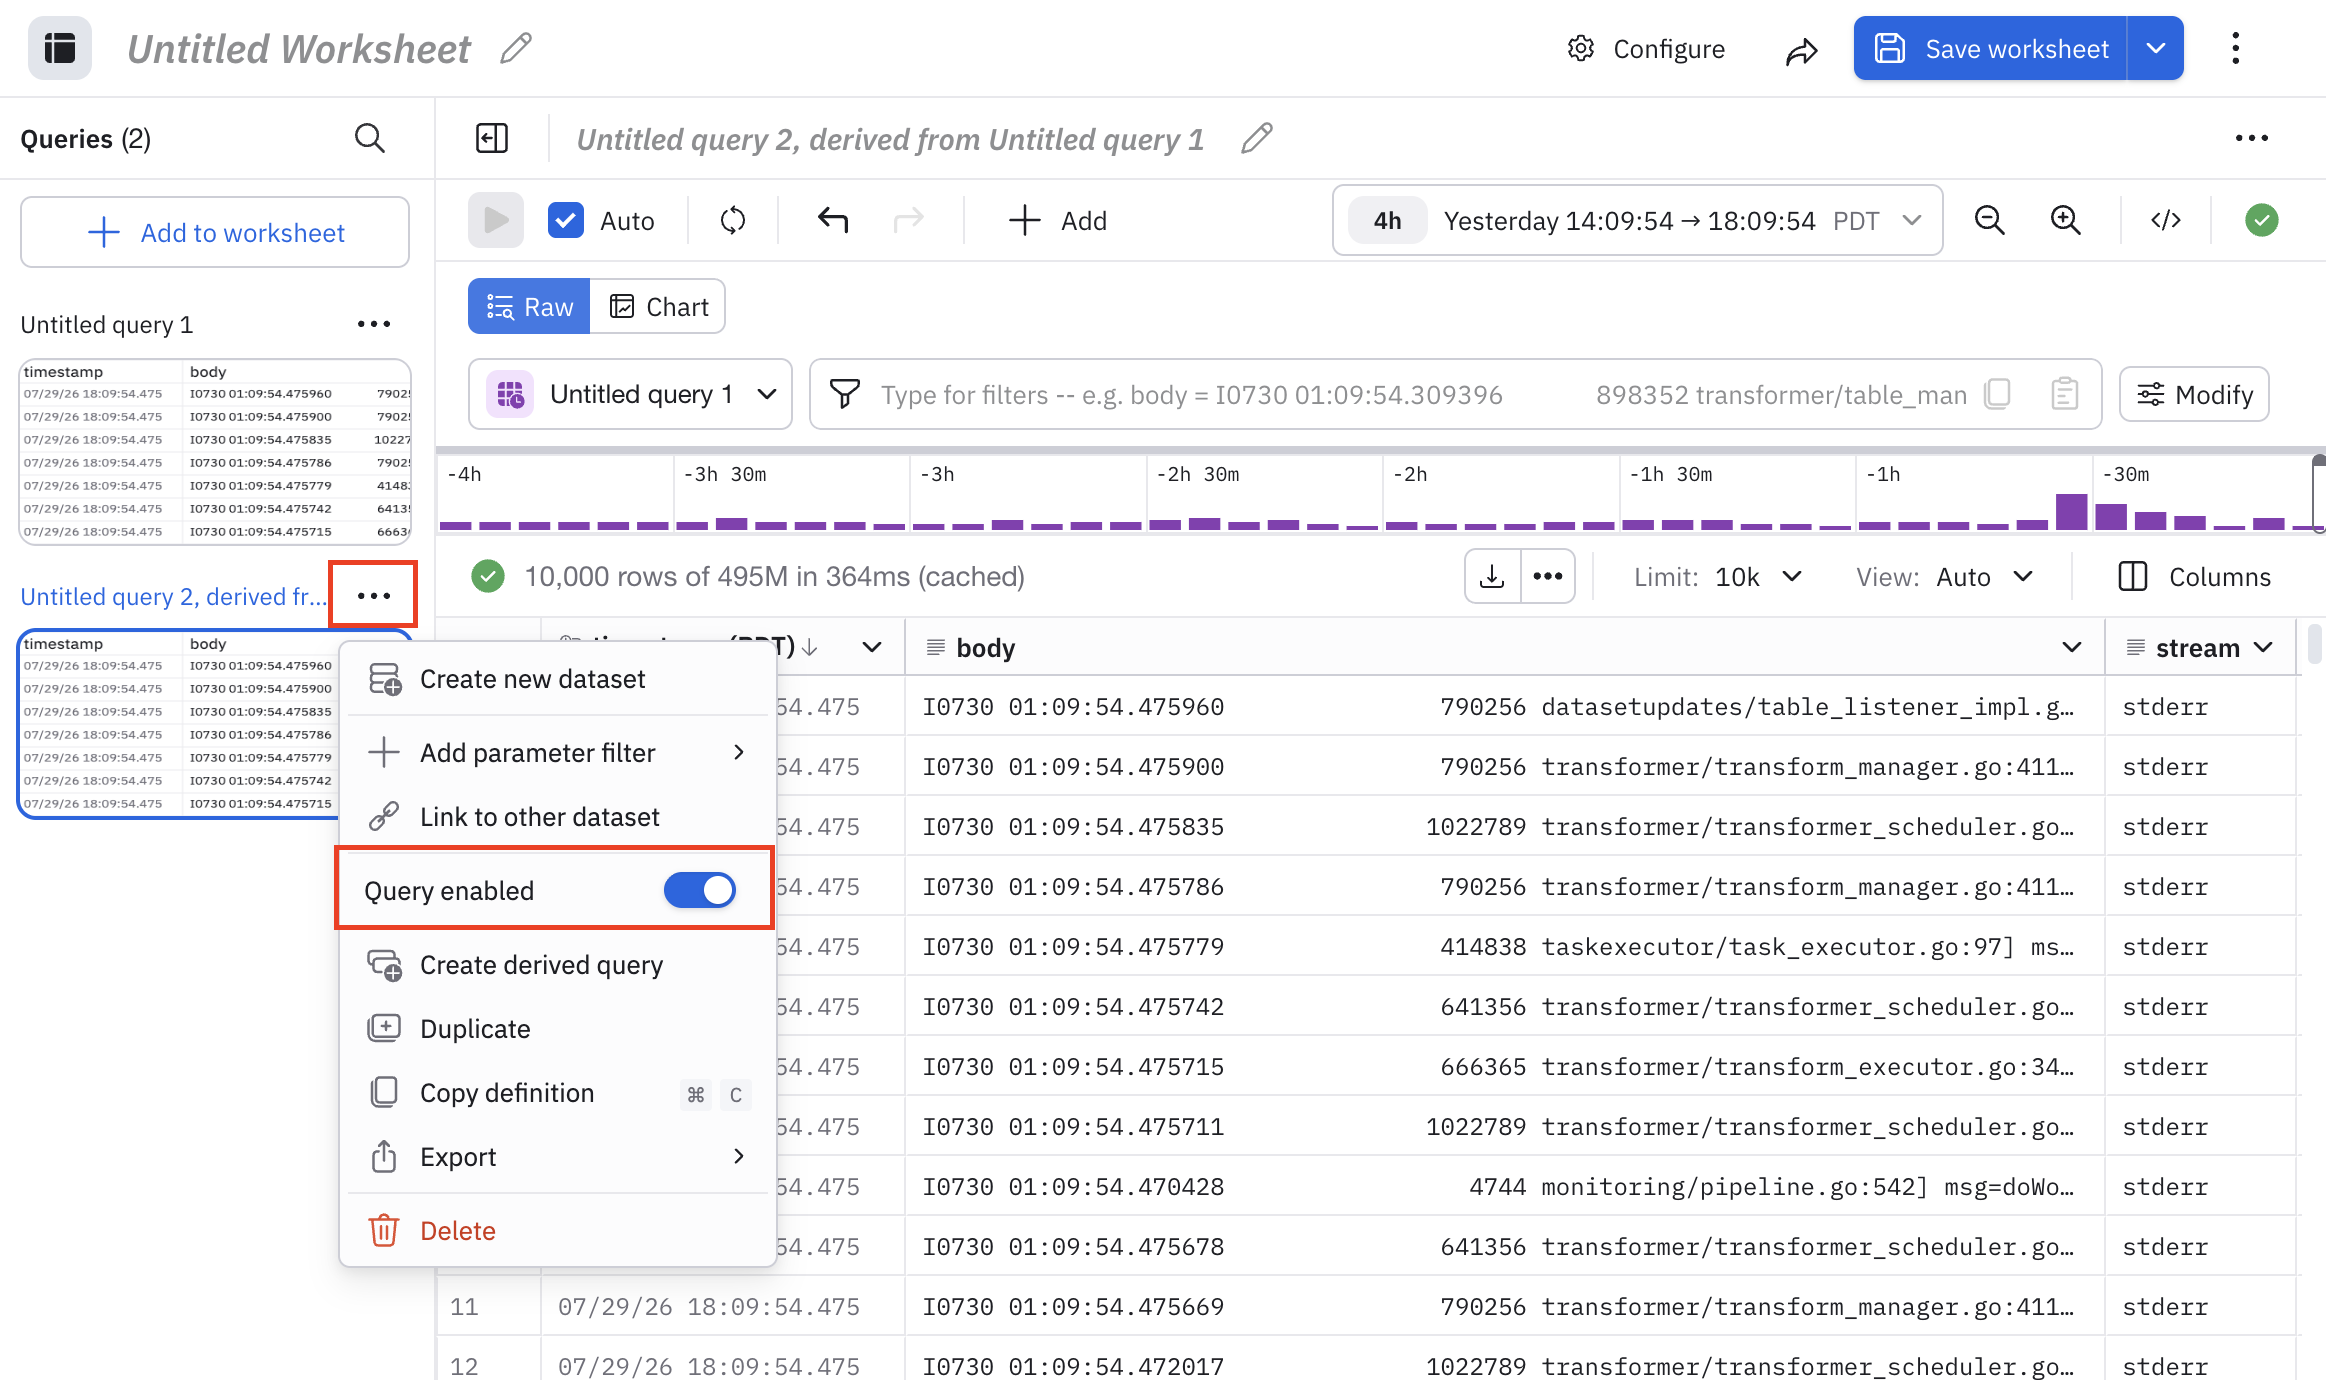
This per-query menu offers other options as well:
| Option | Description |
|---|---|
| Create new dataset | Publish the output of this query as a new Dataset. |
| Add parameter filter | Add filter parameters to this query. |
| Link to other dataset | Connect this Dataset to an existing Dataset which contains a primary key by linking to it. |
| Duplicate | Duplicate this query within the same Worksheet. This differs from a derived query as follows:
|
| Copy definition | Copy the query so that you can paste it into a new Worksheet, or a new dashboard card, or even share it with other Observe by Snowflake users. |
| Export | Provides the following additional options:
|
Pivot to resources
Using the context menu from a cell containing a resource, you will see the resource listed in blue. Click that line for options, including "Open in Resource Explorer." This option allows you to keep context as established by your Worksheet, such as time or parameters, so that you can more usefully search for relevant data.
Updated about 1 month ago