

Seasonal Anomaly Monitor example: Observe by Snowflake user queries
Learn how to create a Seasonal Anomaly Monitor.
Private preview feature (Invite only)This feature is enabled per tenant by Observe by Snowflake and is not generally available. To participate, contact your Observe by Snowflake representative. You may access and use this preview feature solely for internal evaluation purposes. Previews are provided as-is. Your use of this preview is subject to the Snowflake Preview Terms located at https://www.snowflake.com/en/legal.
What is a Seasonal Anomaly Monitor?
Seasonal Anomaly Monitors watch a metric and alert you when it strays from the pattern it normally follows, while accounting for the fact that “normal” changes with the time of day and the day of the week.
Seasonal Anomaly Monitors are built for signals whose ups and downs are expected and repeating, such as traffic that climbs every morning and quiets down at night, jobs that run heavier on weekdays, or usage that dips over the weekend. For this kind of data, a static threshold won't work, because a value that’s perfectly healthy at 2pm on a Tuesday might be a serious problem at 3am on a Sunday. A single number can’t be right for both.
A quick example: think of requests per second for a customer-facing API. It peaks mid-afternoon, drops overnight, and is lighter on weekends. There’s no single “too high” or “too low” number that holds all week. A seasonal monitor learns that rhythm and flags the moments that don’t fit it — a midday collapse, or a 3am spike that would look normal at noon.
How to choose an Anomaly Monitor algorithm
If your metric has no repeating cycle, such as an error count that should always have a value near zero, the Basic algorithm is the better fit. The following table can help you decide which type of Anomaly Monitor best suits your needs.
| Basic | Seasonal | |
|---|---|---|
| How it decides what's "normal" | Compares each point to a recent rolling average and how much the metric typically varies. | Learns the metric's recurring daily / weekly pattern and predicts an expected band for each moment in time. |
| Best for | Steady metrics, or things that should stay near a baseline. | Data with regular peaks and troughs that repeat by time of day or day of week. |
| Example | Number of API calls, HTTP requests, token usage, to detect anomalous spikes. | Web traffic that peaks midday and drops at night; orders that spike on weekends. |
| Required tuning | • Sensitivity (number of standard deviations) | • Sensitivity (low, high, etc.) • Daily seasonality • Weekly seasonality |
Rule of thumb: pull up a week of the metric on a chart:
- If you can see a repeating shape → Seasonal.
- If it looks flat or random → Basic.
Important concepts
Season Anomalies borrow the same concepts as regular Anomaly Monitors. See Anomaly Monitor example: High number of APM service exceptions. You must know the following additional concepts when you configure Seasonal Anomalies:
| Concept | Description |
|---|---|
| Sensitivity | How tight the anomaly band is (and therefore how easily points get flagged). This is very similar to the “number of standard deviations” that basic anomaly detection uses. Unlike the number of standard deviations (1 to 5), available options are in natural language:
|
| Daily seasonality | The length of the seasonality cycle in days. Allowed values: 1 to 30. N days means “the time series has a pattern that repeats every N days” |
| Weekly seasonality | The length of the seasonality cycle in weeks. Allowed values: 1 to 4. N days means “the time series has a pattern that repeats every N weeks” |
Daily and weekly seasonality parameters are completely independent and do not affect each other.
The training window used by the algorithm is chosen automatically based on the selected seasonality, as longer seasonality cycles require more training data. This setting is NOT customizable. We ensure that the algorithm is trained with more than enough data to be as accurate as possible!
Create a Seasonal Anomaly Monitor
Perform the following steps to get started with creating this anomaly Monitor:
- Click Monitoring on the left navigation rail.
- Click New monitor.
- Click Anomaly.
- Give the Monitor a name: Anomaly Monitor for Observe User Queries
- In the Monitor query section, select the Observe User Query Dataset.
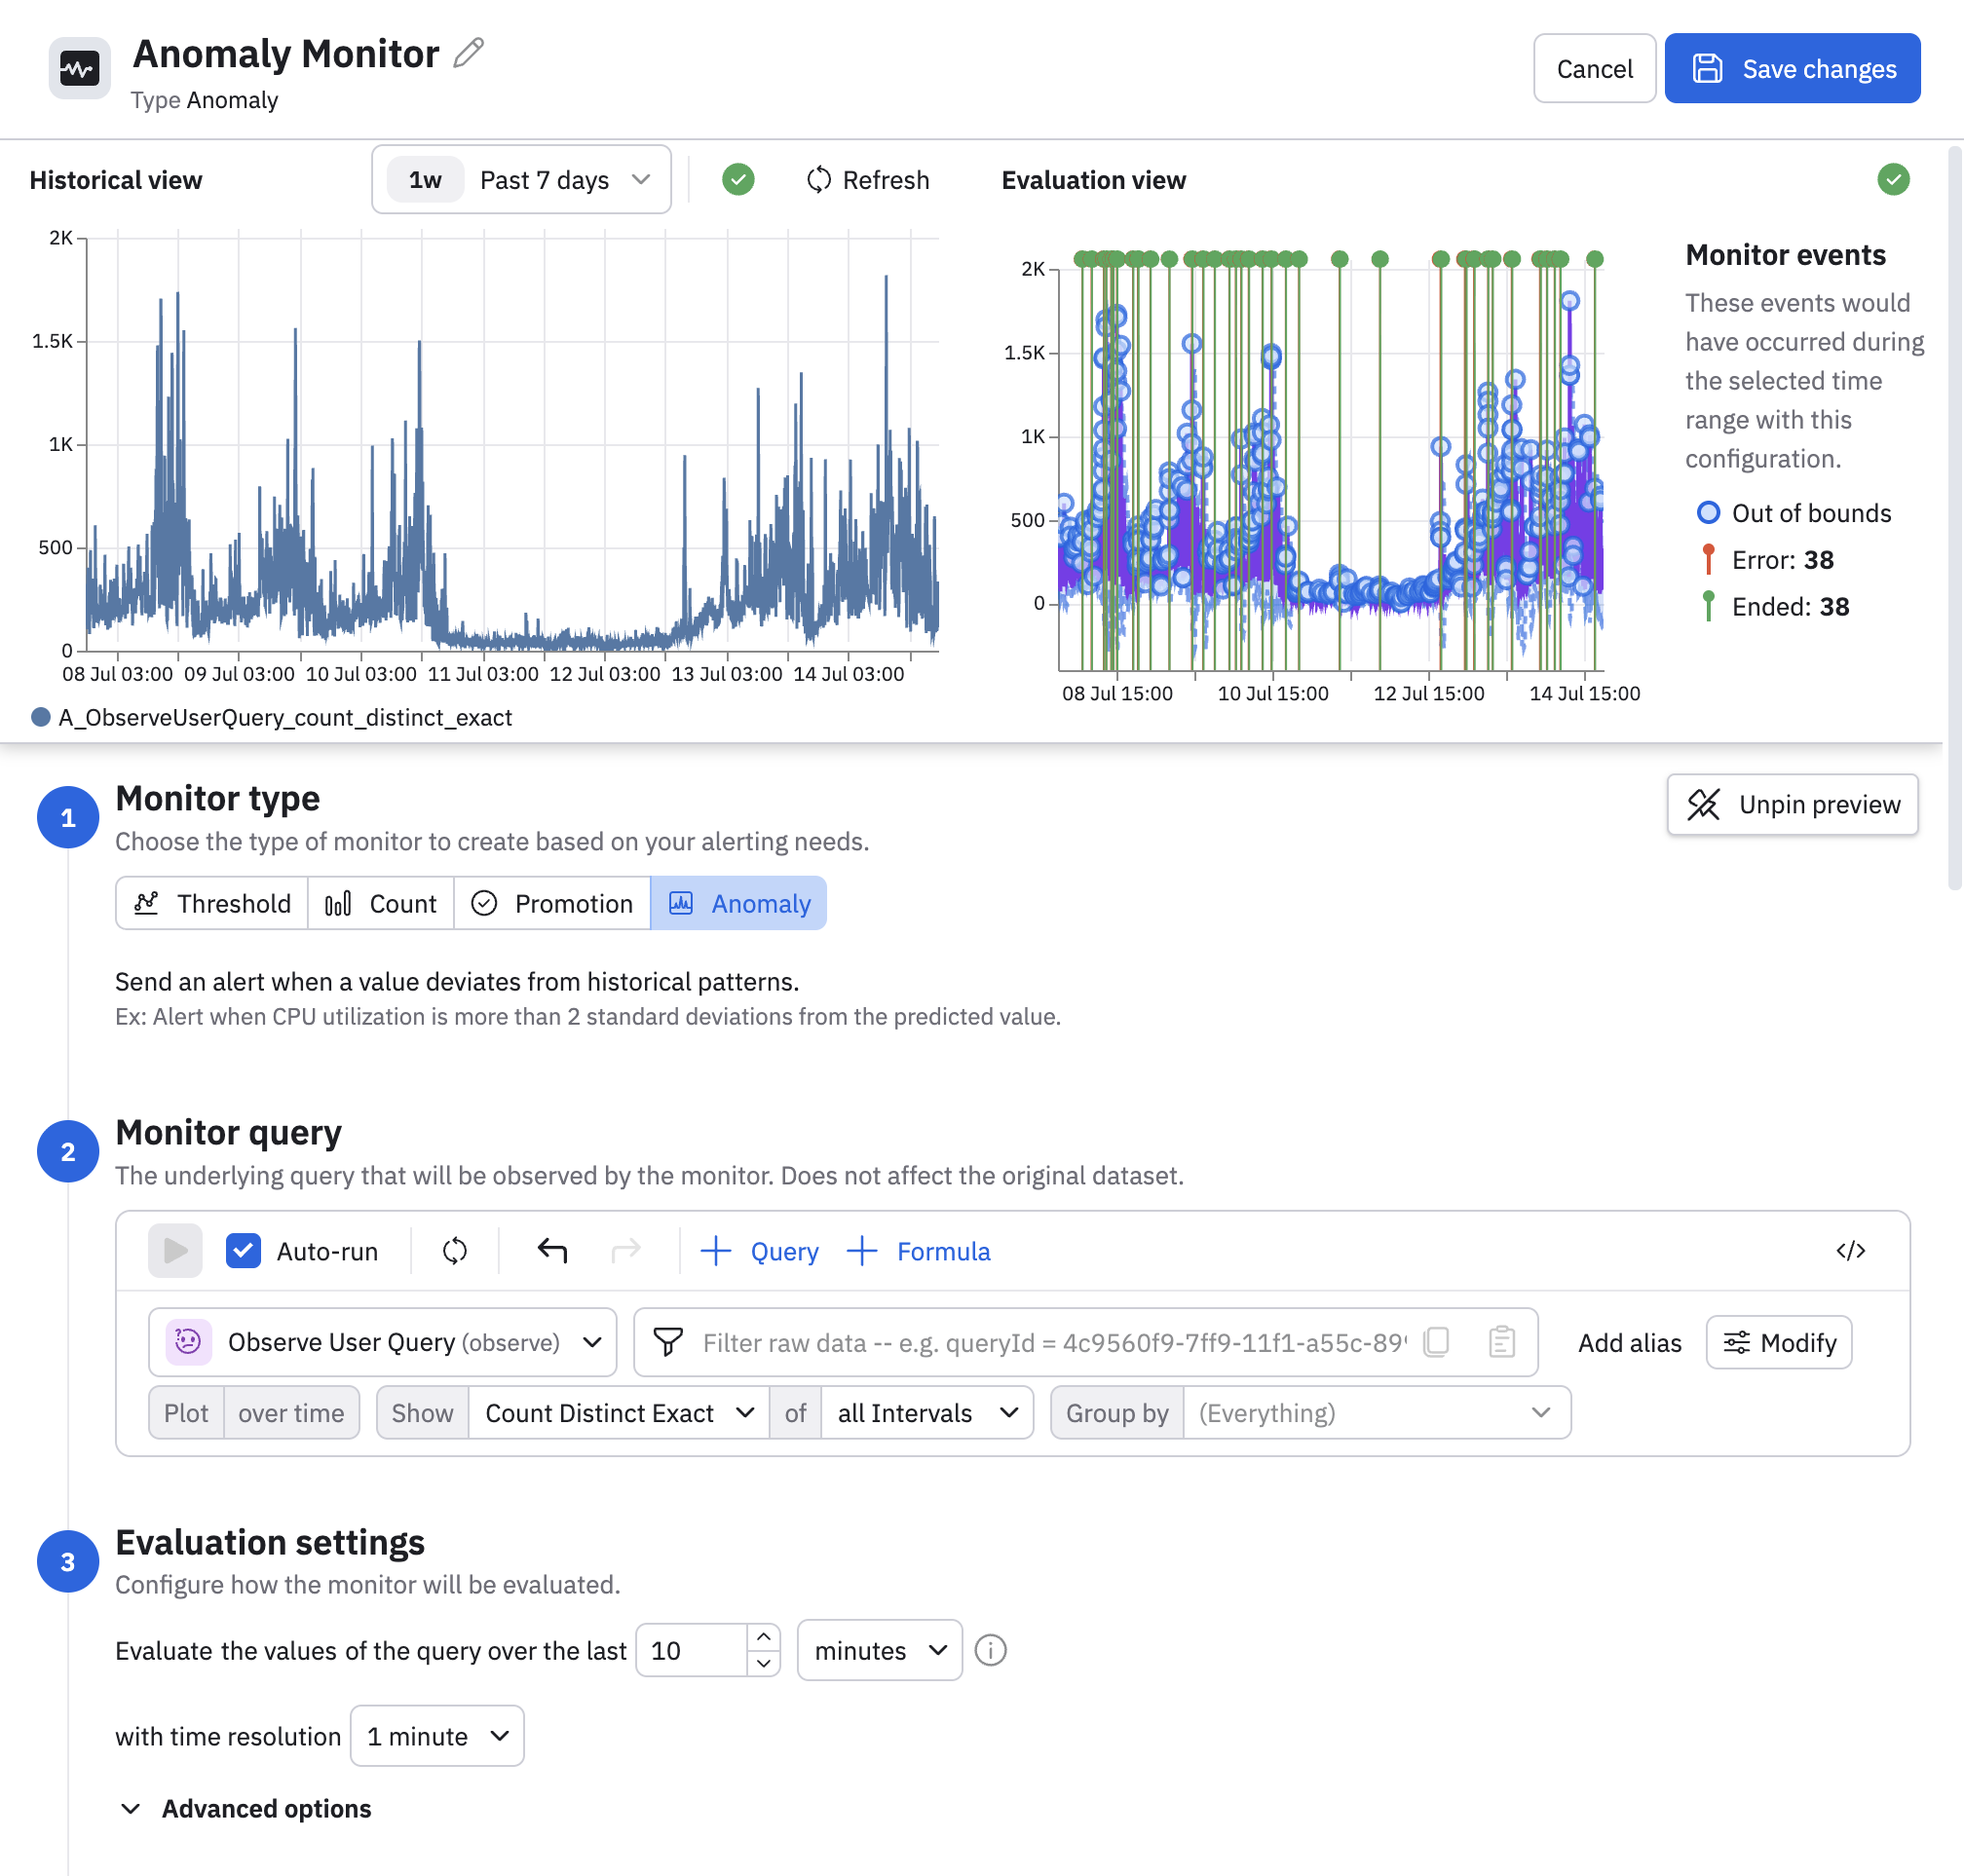
This summary shows the total number of user queries in Observe by Snowflake for the last 7 days. You can see the regular and expected spikes in activity on a daily basis, and then little activity on the weekend, Saturday July 11 and Sunday July 12.
Configure how the Monitor is evaluated
In the Evaluation settings section, adjust the time window so analyze activity within the last 10 hours.
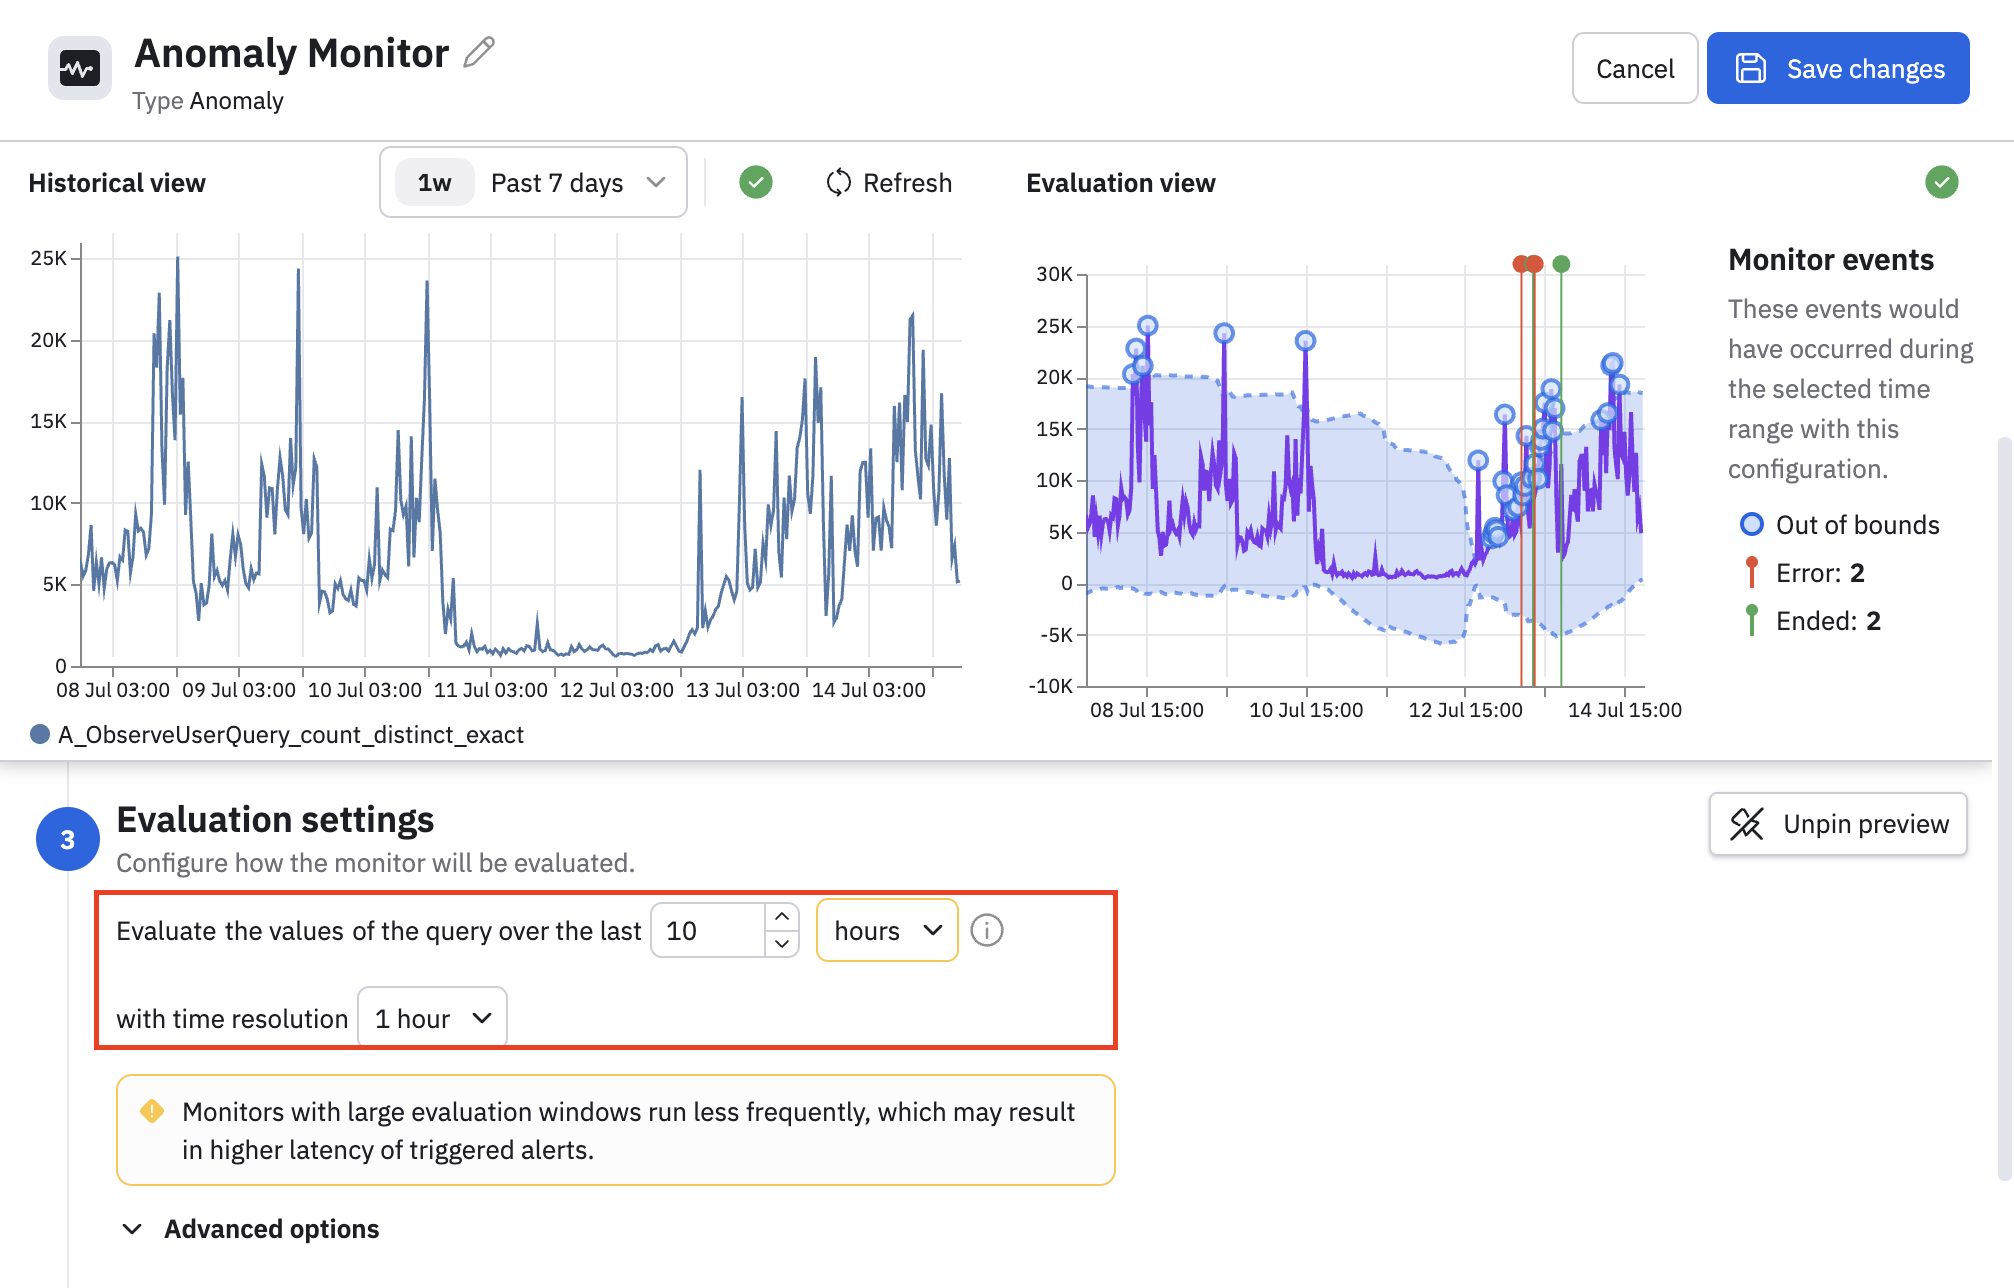
See Anomaly Monitor example: High number of APM service exceptions for more information about the options in the Evaluation settings section.
Select the Anomaly Monitor type and other alerting rules
In the Alerting rules section, select the seasonal algorithm to create a Seasonal Anomaly Monitor.
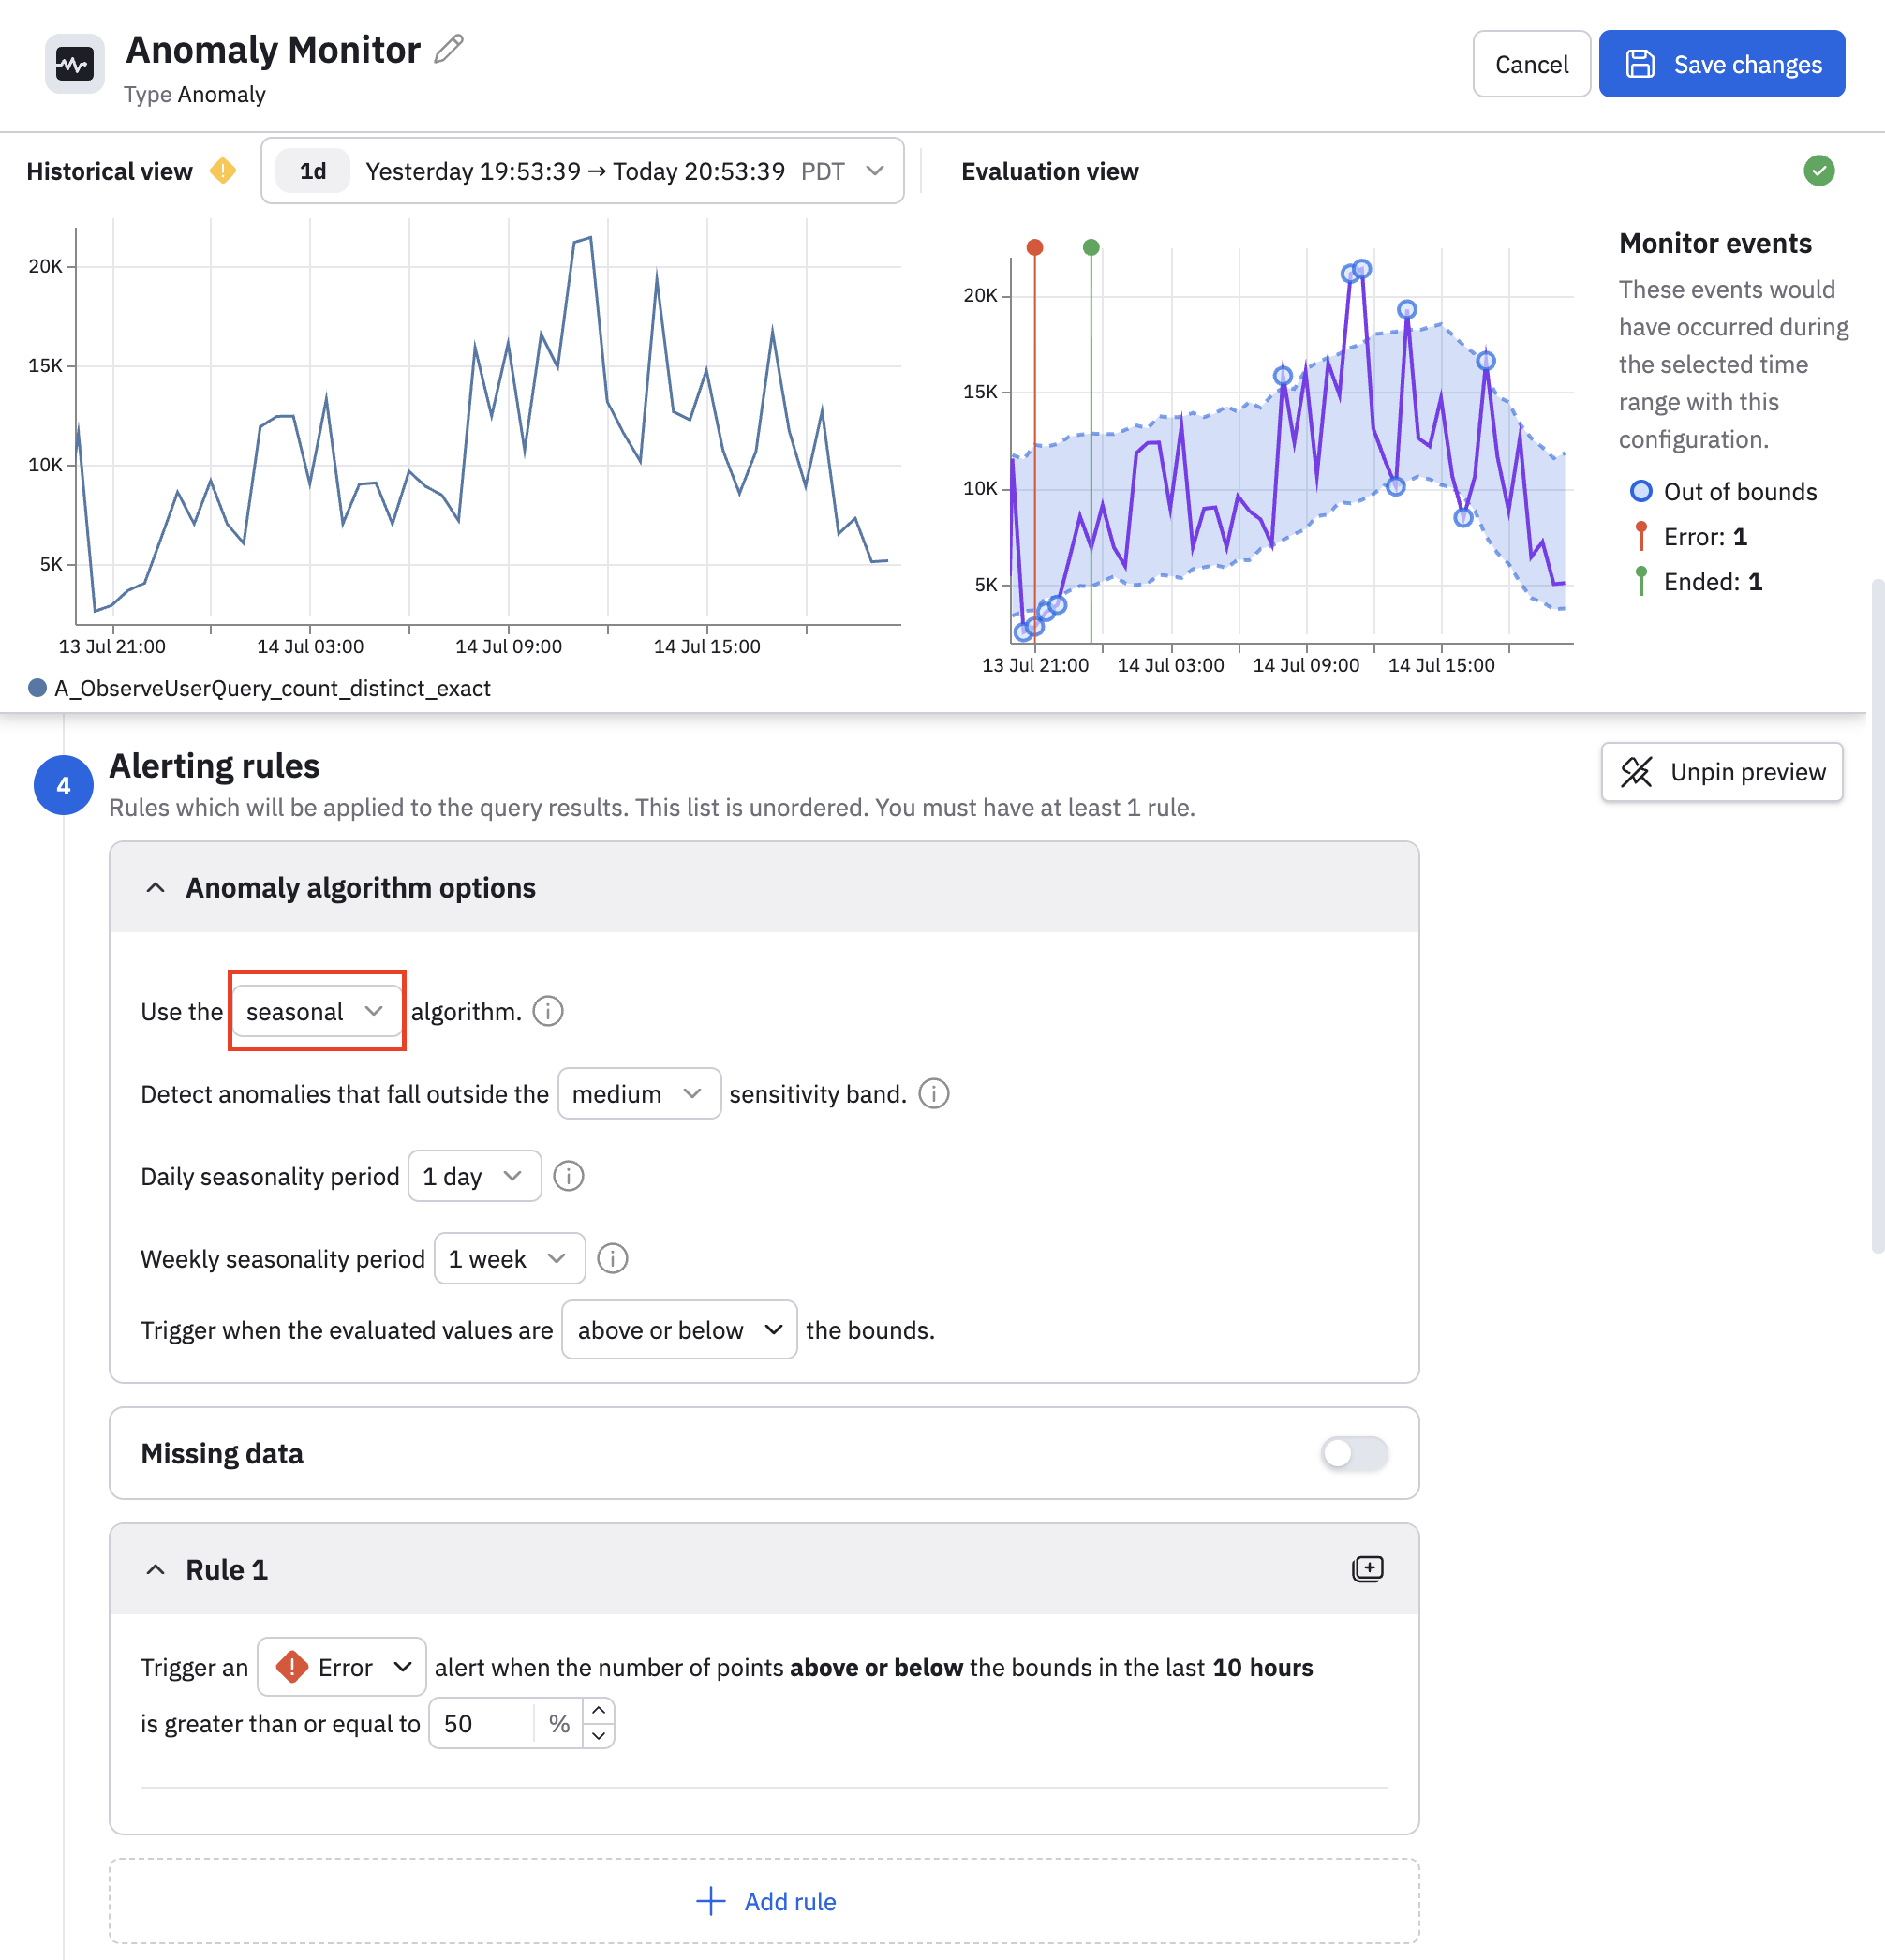
In this example, we can leave the other default value as-is. Those other values are described in the following sections.
You should configure at least one daily of weekly seasonality period, if you set both to off, configure a basic algorithm Anomaly Monitor instead.
Configure sensitivity settings
The sensitivity settings control how tight the expected band is, and therefore how easily a point gets flagged.
- Options:
low,medium,high,very high - Default:
medium
Think of it as widening or narrowing the band:
- Higher sensitivity → narrower band → more anomalies flagged (catches smaller deviations)
- Lower sensitivity → wider band → fewer anomalies flagged (only large deviations)
| Setting | Behavior | Good for |
|---|---|---|
| low | Widest band, fewest alerts | Noisy or bursty metrics where you only want big, obvious deviations |
| medium (default) | Balanced | A solid starting point for most metrics |
| high | Narrower band, more alerts | Stable metrics where smaller deviations matter |
| very high | Tightest band, most alerts | Critical, very stable metrics where subtle drifts matter (expect more noise) |
To effectively tune your Seasonal Anomaly Monitor, start at medium sensitivity, let it run a few days, then adjust if needed. If you are seeing too many/ alerts or false alerts, move toward low sensitivity. If you are missing real deviations, move toward high or very high. Sensitivity pairs with the rule threshold, for example, a narrow band + high percentage threshold is a good “only fire when it’s clearly broken” combination.
Configure the daily seasonality period
A daily seasonal period tells the Monitor to learn a pattern that repeats on a daily cycle, such as the shape your metric traces over a day, like busy afternoons, and quiet nights.
- Options:
off(default), or1 day…30 days - Default:
off(clear the selection to turn it off)
| Setting | Meaning | When to use |
|---|---|---|
| off | No daily pattern is learned. | Metric has no time-of-day rhythm. |
| 1 day | Learns a standard 24-hour cycle. | The common choice, for most metrics with an intraday shape. |
| 2+ days | Learns a cycle that spans multiple days. For example, 2 = 48h, 3 = 72h, and so on. | Rare, only for genuine multi-day cycles, such as an every-other-day batch. |
Configure the weekly seasonality period
The weekly seasonal period tells the monitor to learn a pattern that repeats weekly, such as the difference between a Wednesday and a Saturday.
- Options:
off(default), or1 week…4 weeks - Default:
off
| Setting | Meaning | When to use |
|---|---|---|
| off | No weekly pattern is learned. | Metric looks the same every day. |
| 1 week | Learns a standard 7-day cycle. | The common choice — weekday/weekend or day-of-week differences. |
| 2+ weeks | Learns a cycle that spans multiple weeks. Use 2 = 14 days, 3 for 21 days, and so on. | Rare — only for genuine multi-week cycles. |
TipIf your metric behaves differently on weekends, set this to
1 week. Combining Daily = 1 day with Weekly = 1 week captures the most common real-world shape: a daily rhythm that also shifts across the week.
Configure the direction
Set the direction to choose whether values that go above the band, below the band, or on either side of the band count as anomalies.
| Setting | Alerts when the metric... | Typical use |
|---|---|---|
| above or below (default) | Goes higher or lower than expected. | You care about any unusual behavior. |
| above | Goes higher than expected. | You care about error rate, latency, or queue depth, where "up" is bad. |
| below | Goes lower than expected. | You care about throughput, orders, or active users, where a sudden drop is the problem. |
View a preview of any warnings or alerts
You can get a preview of any warnings or alerts generated based on your data and the sensitivity, seasonality, and direction settings you configure.
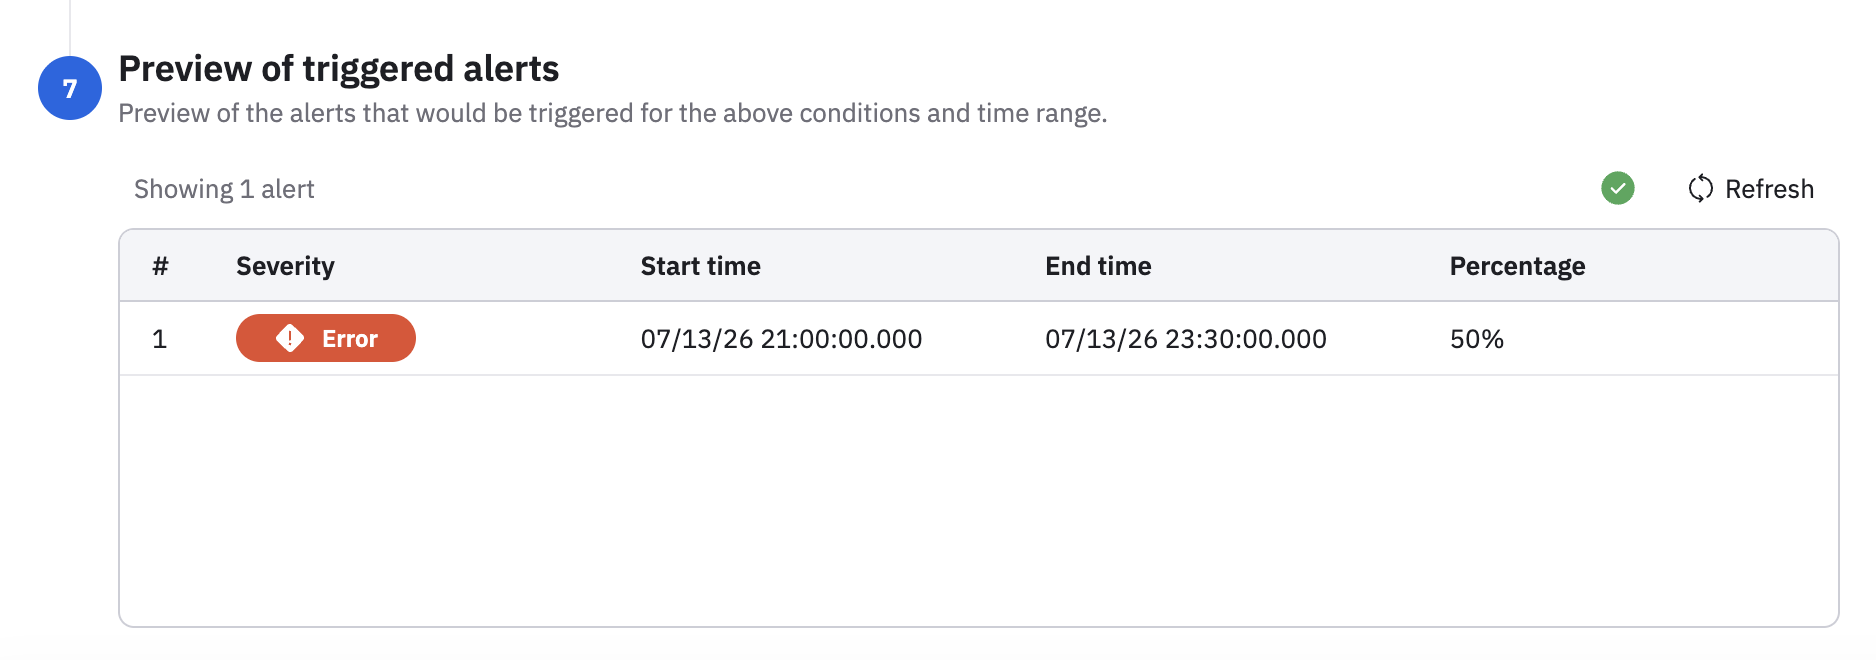
You can use the preview as a gauge to determine if your configured settings are acceptable for your use case, in terms of seeing whether or not the appropriate amount of alerts are being generated.
Complete the Seasonal Anomaly configuration
To complete the Seasonal Anomaly configuration, provide a description and any desired alerting actions, then click Save changes.
Updated about 1 month ago