

Service monitoring workflow
As an site reliability engineer (SRE), you want to be able to clearly distinguish between monitored and unmonitored services so that you can identify visibility gaps and prioritize unhealthy nodes during incidents.
Create a service Monitor
You can create Monitors for any service directly from the Service Map.
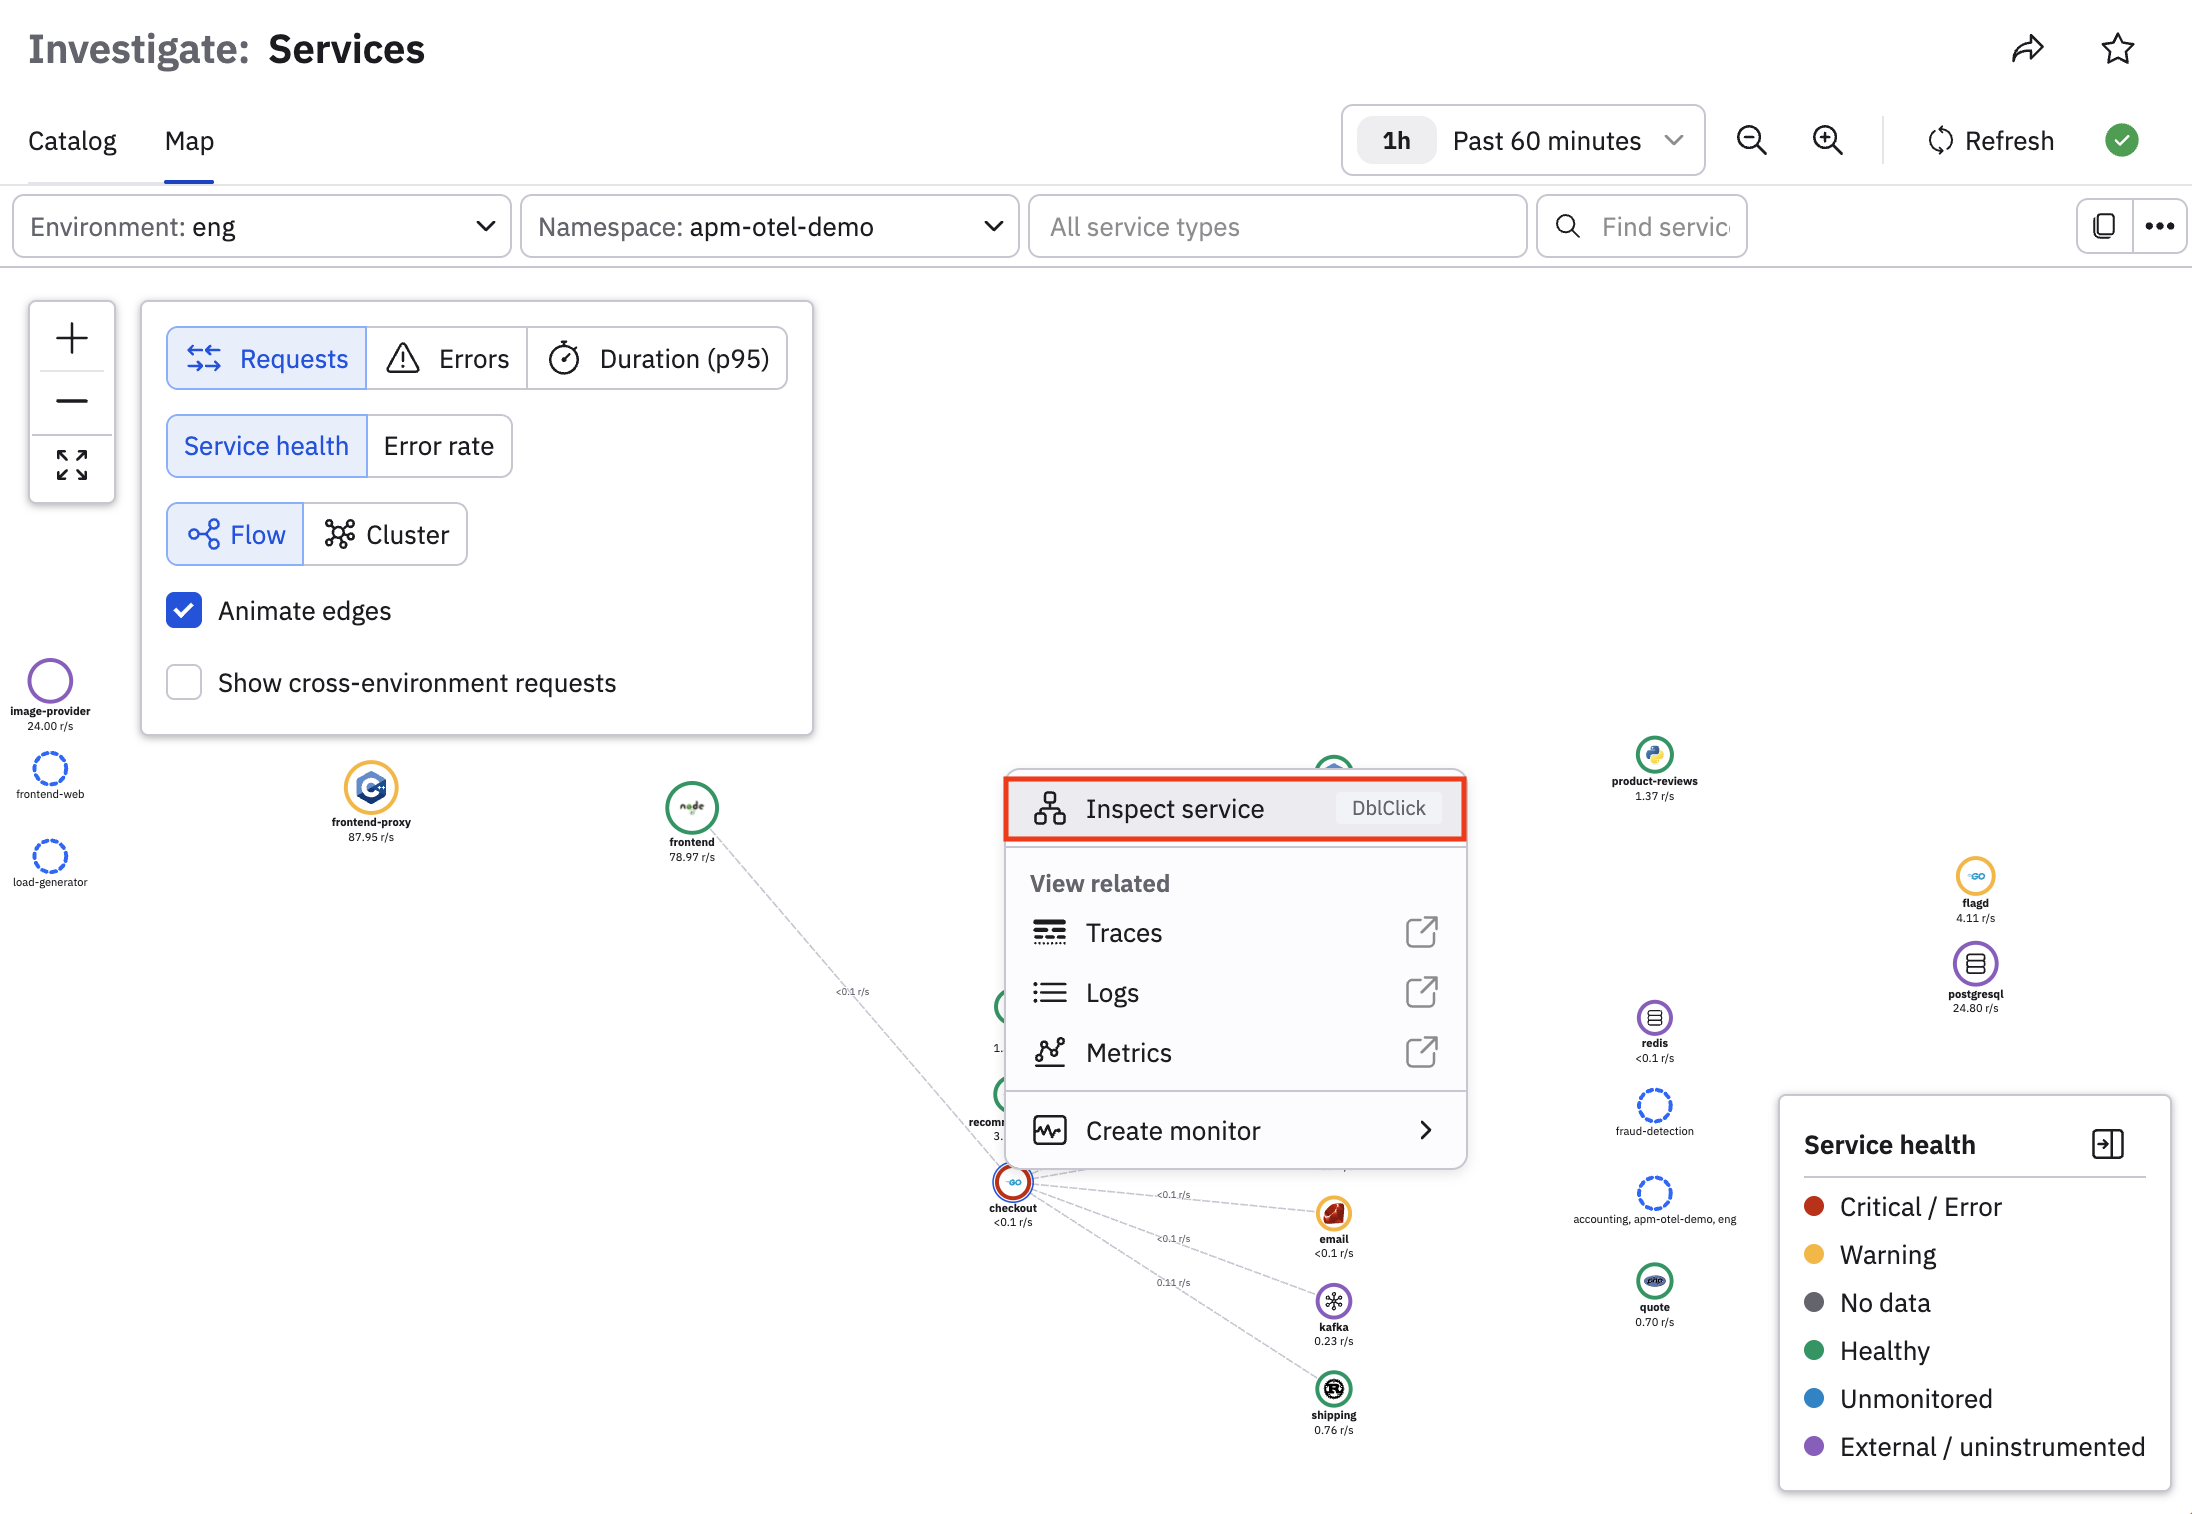
From the Service Map, suppose we want to build a Monitor for the checkout service to explore p95 duration statistics. Click on the checkout node and select Create monitor, then select the Monitor type, in this case, Duration p95:
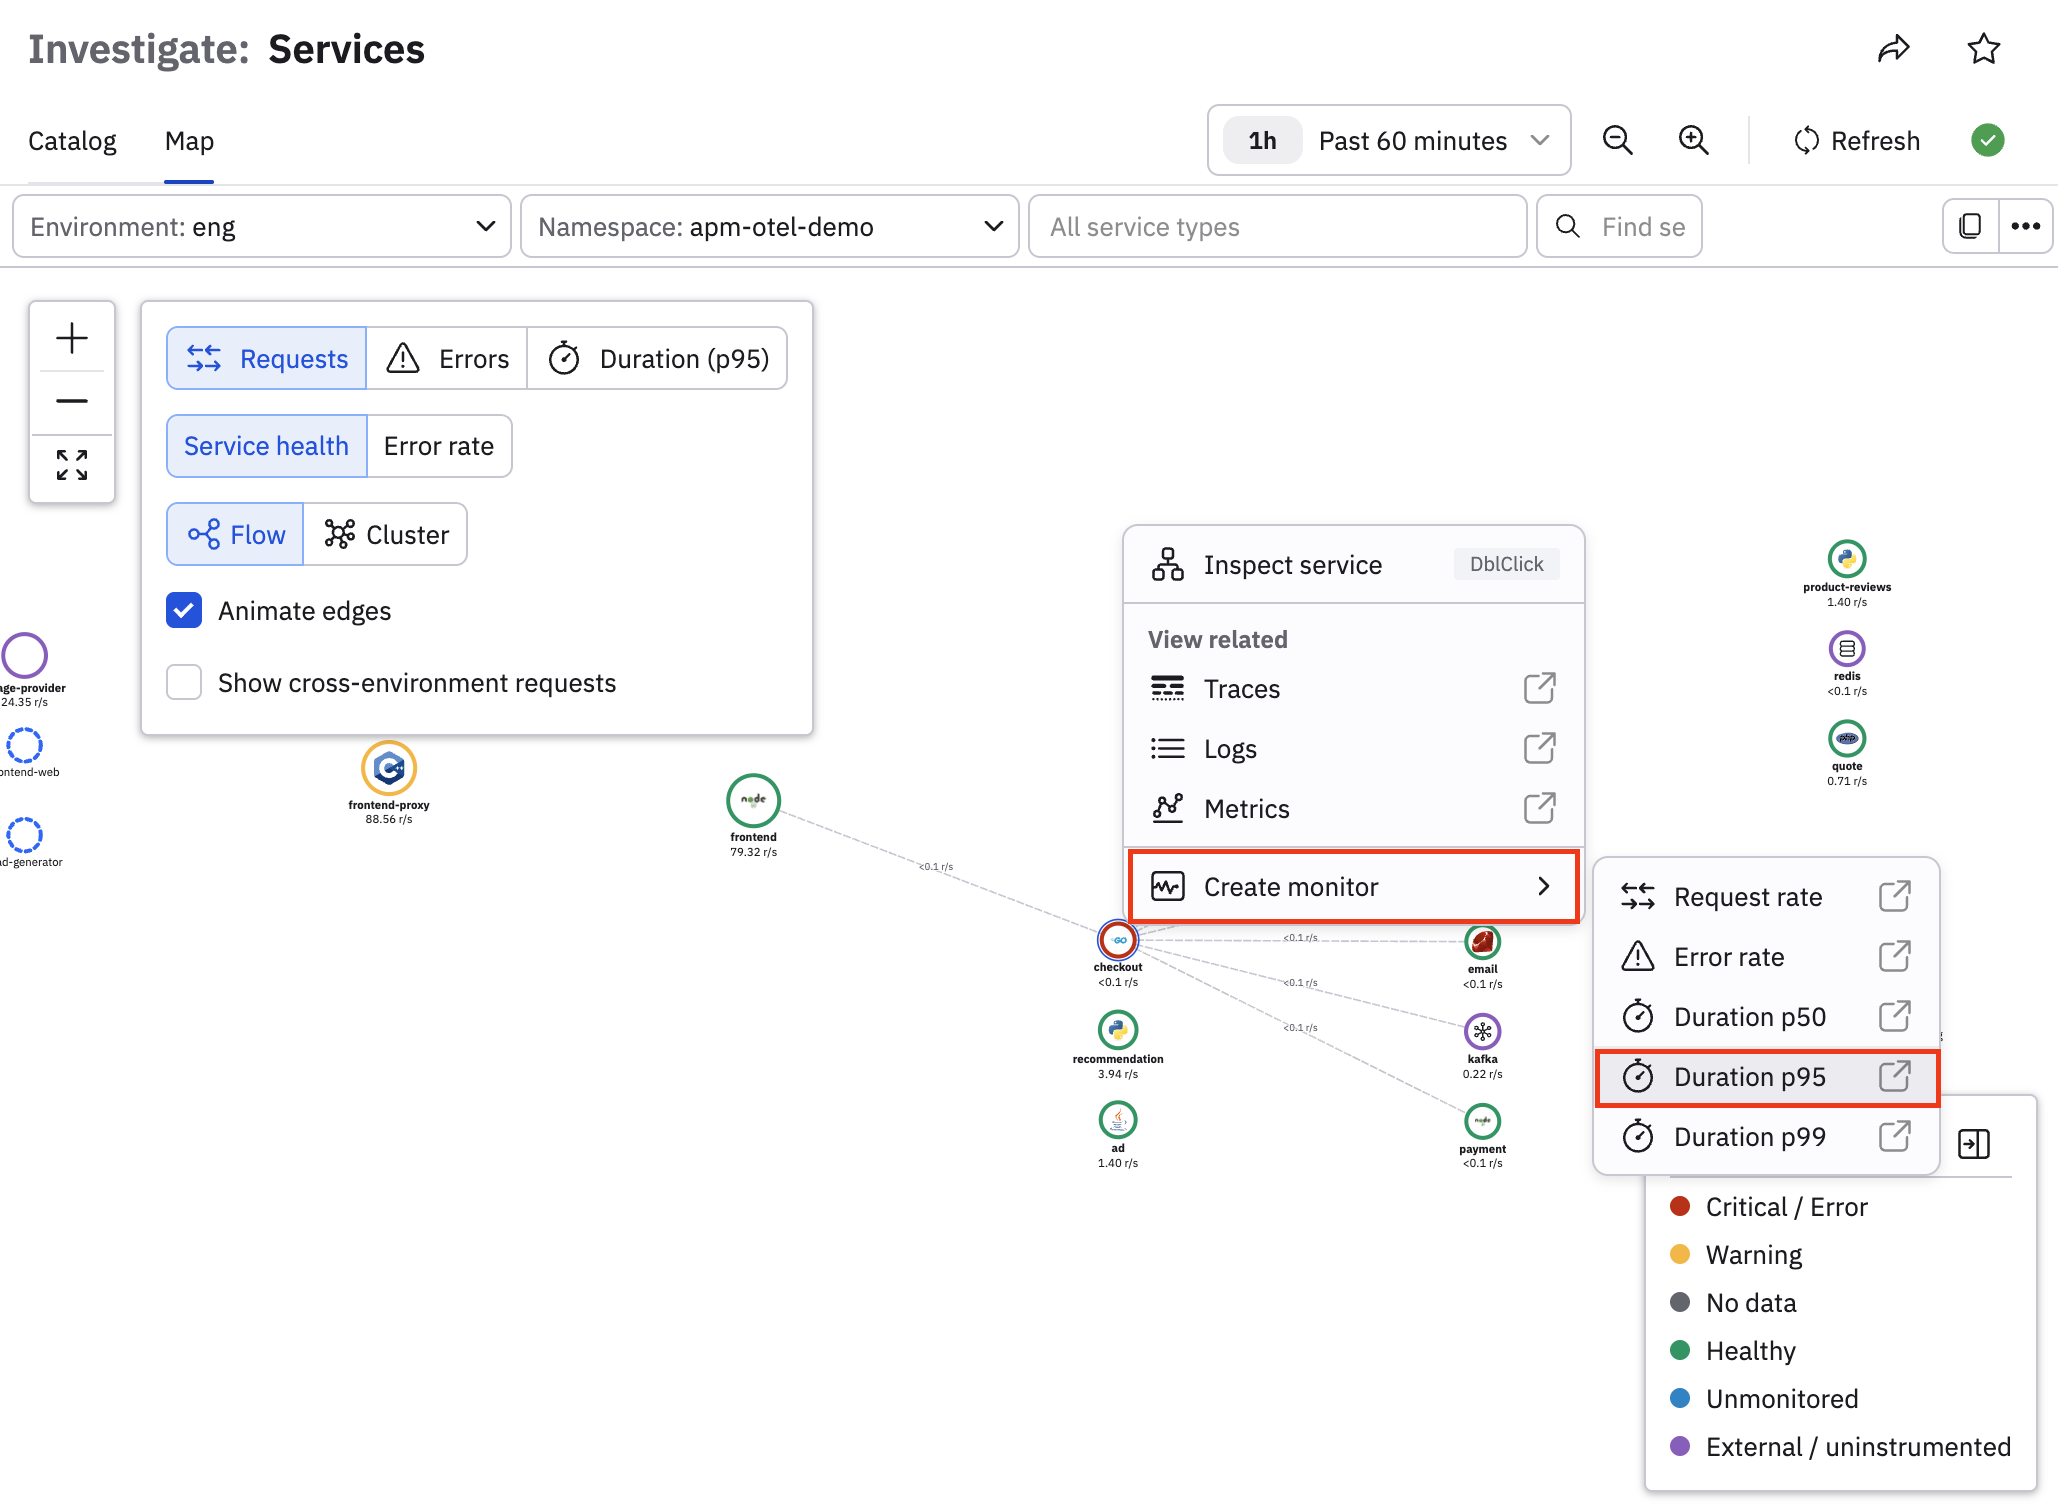
When you create the Monitor by pivoting from a service in the Service Map or Service Inspector, the binding settings and query filters are taken care of for you:
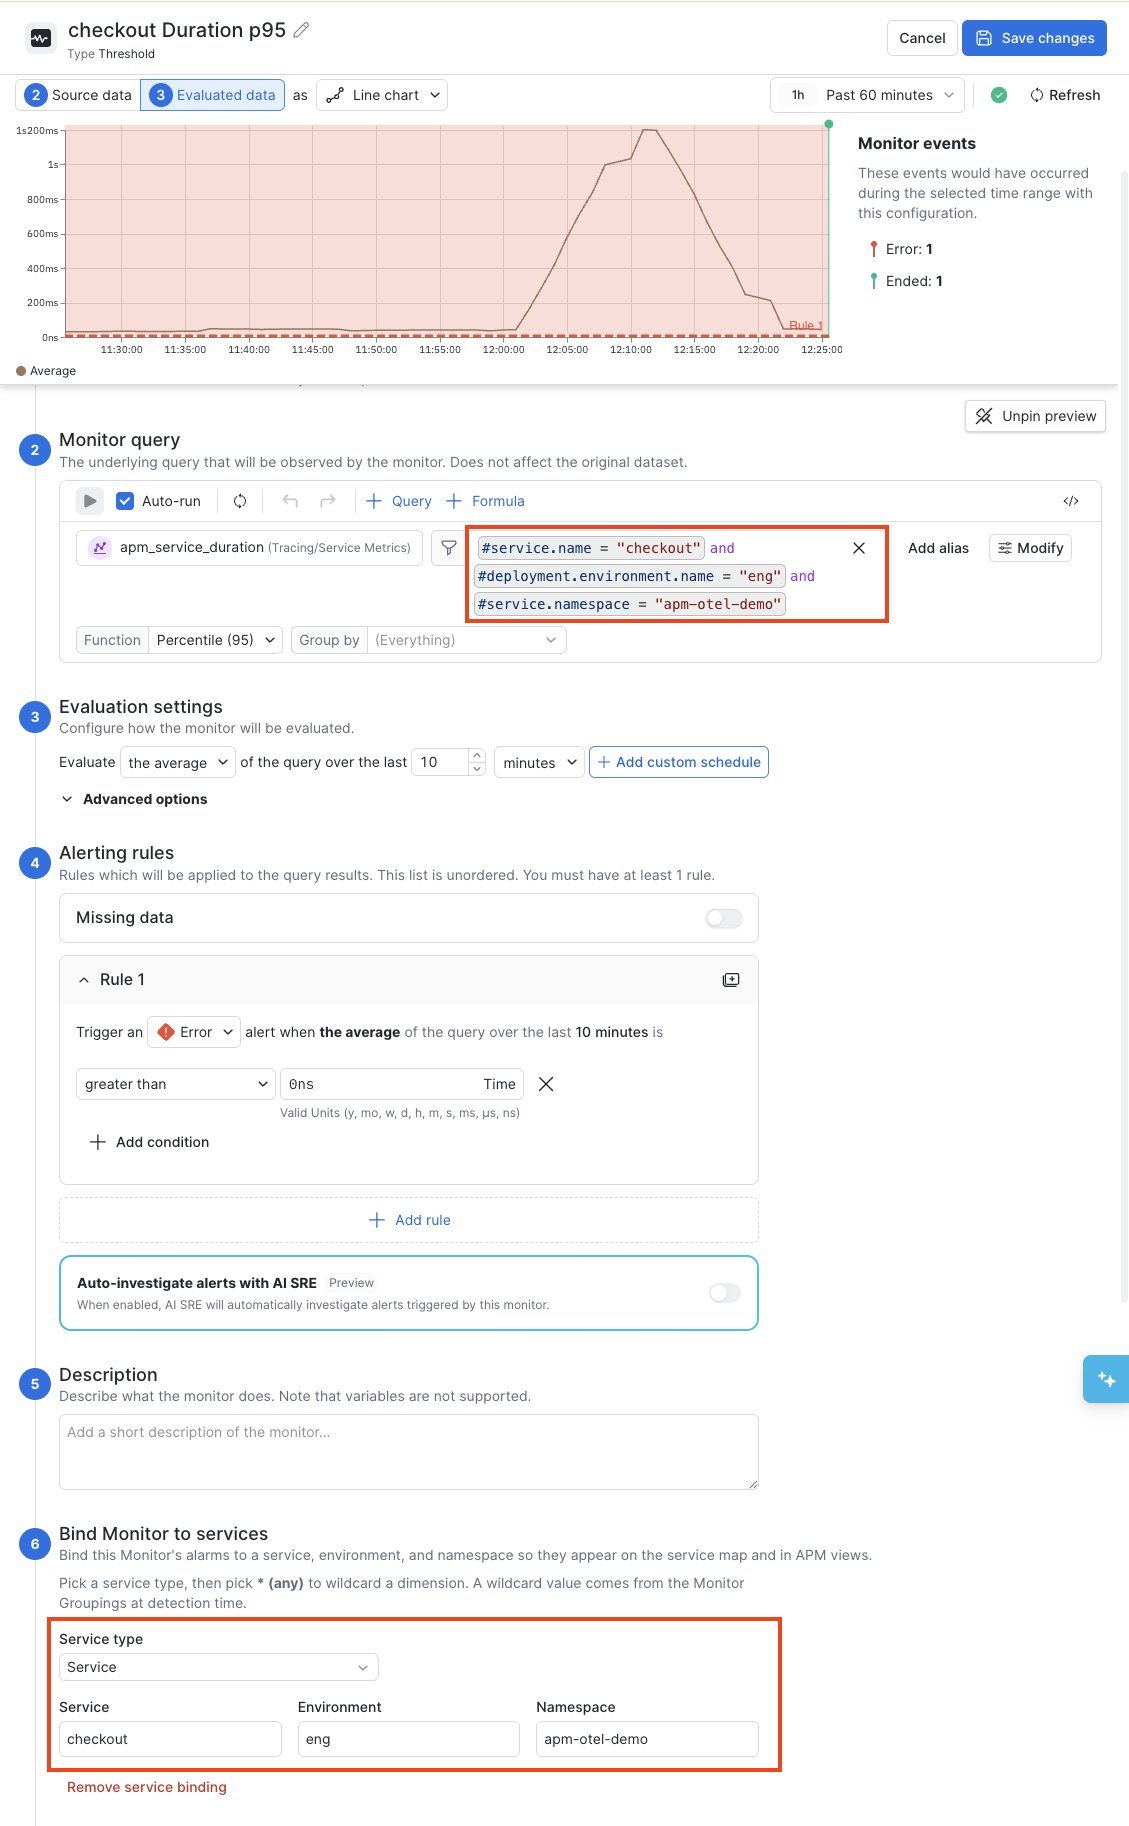
When you create the Monitor from scratch, you must specify the service, environment, and namespace to which the Monitor is bound. See Anomaly Monitor example: High number of APM service exceptions for an example of how to do this.
If you change any of the binding settings, for example, you change the environment from eng to *(any), be sure to also adjust the filter query so that the data you are filtering matches the data you want to alert on. In this case, if you change the Environment binding to *(any), you would also remove the #deployment.environment.name = "eng" filter from the query.
View service health from the Service Map
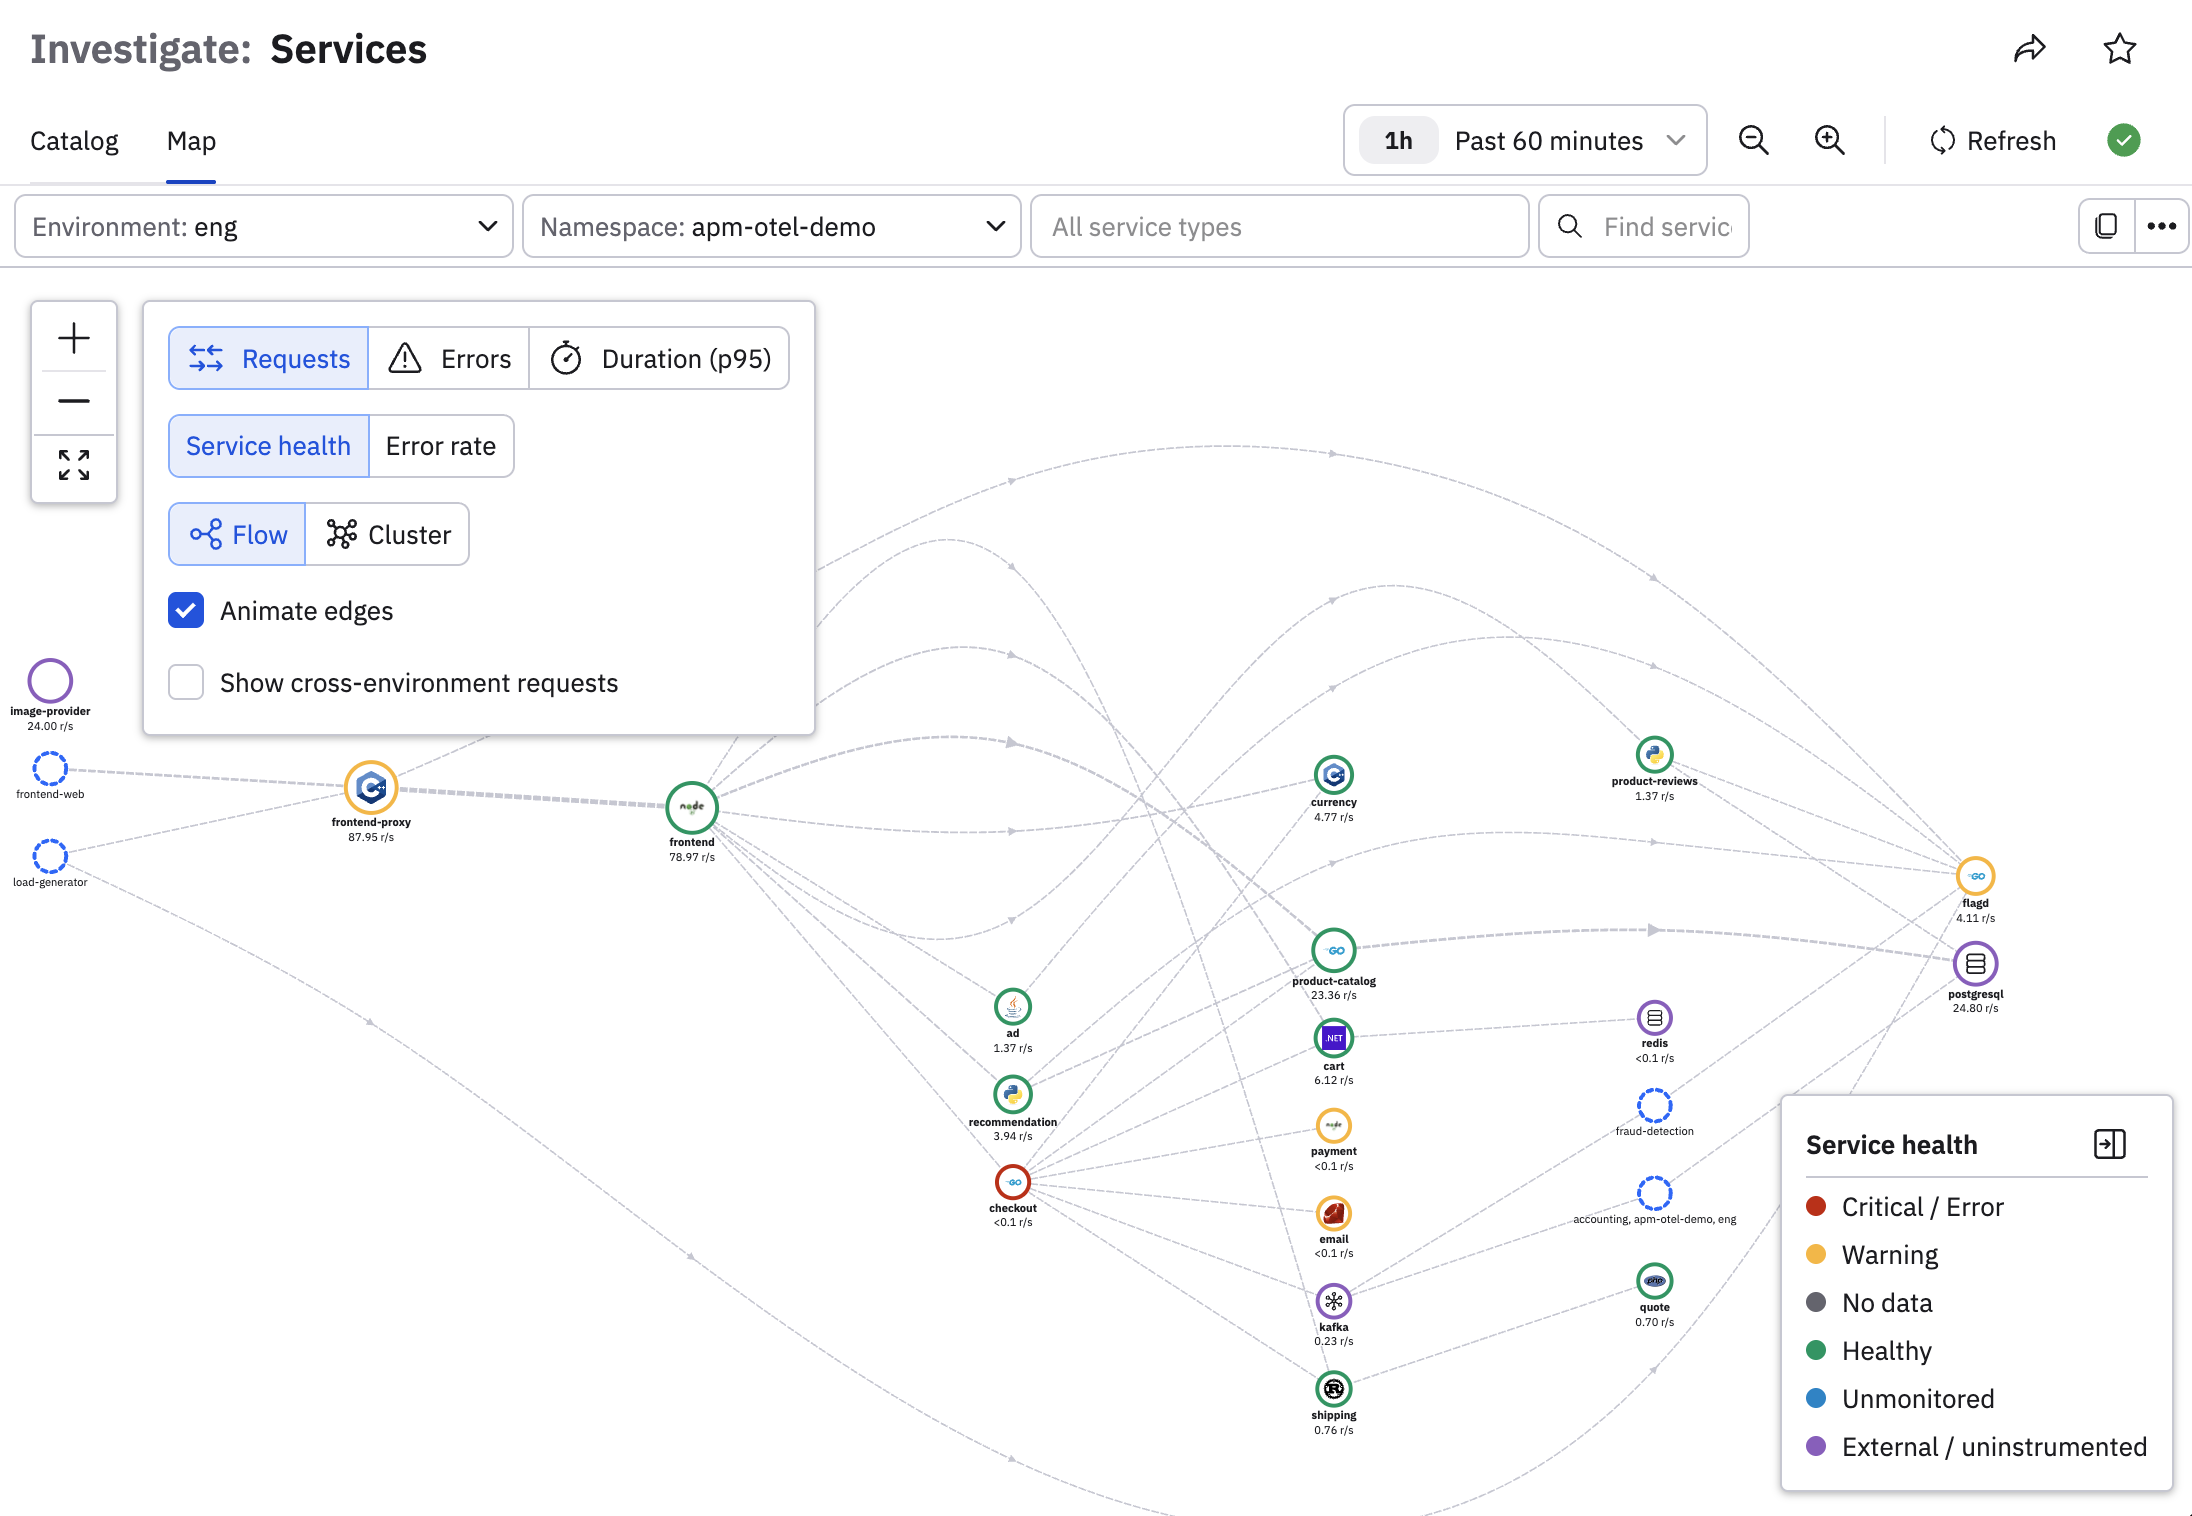
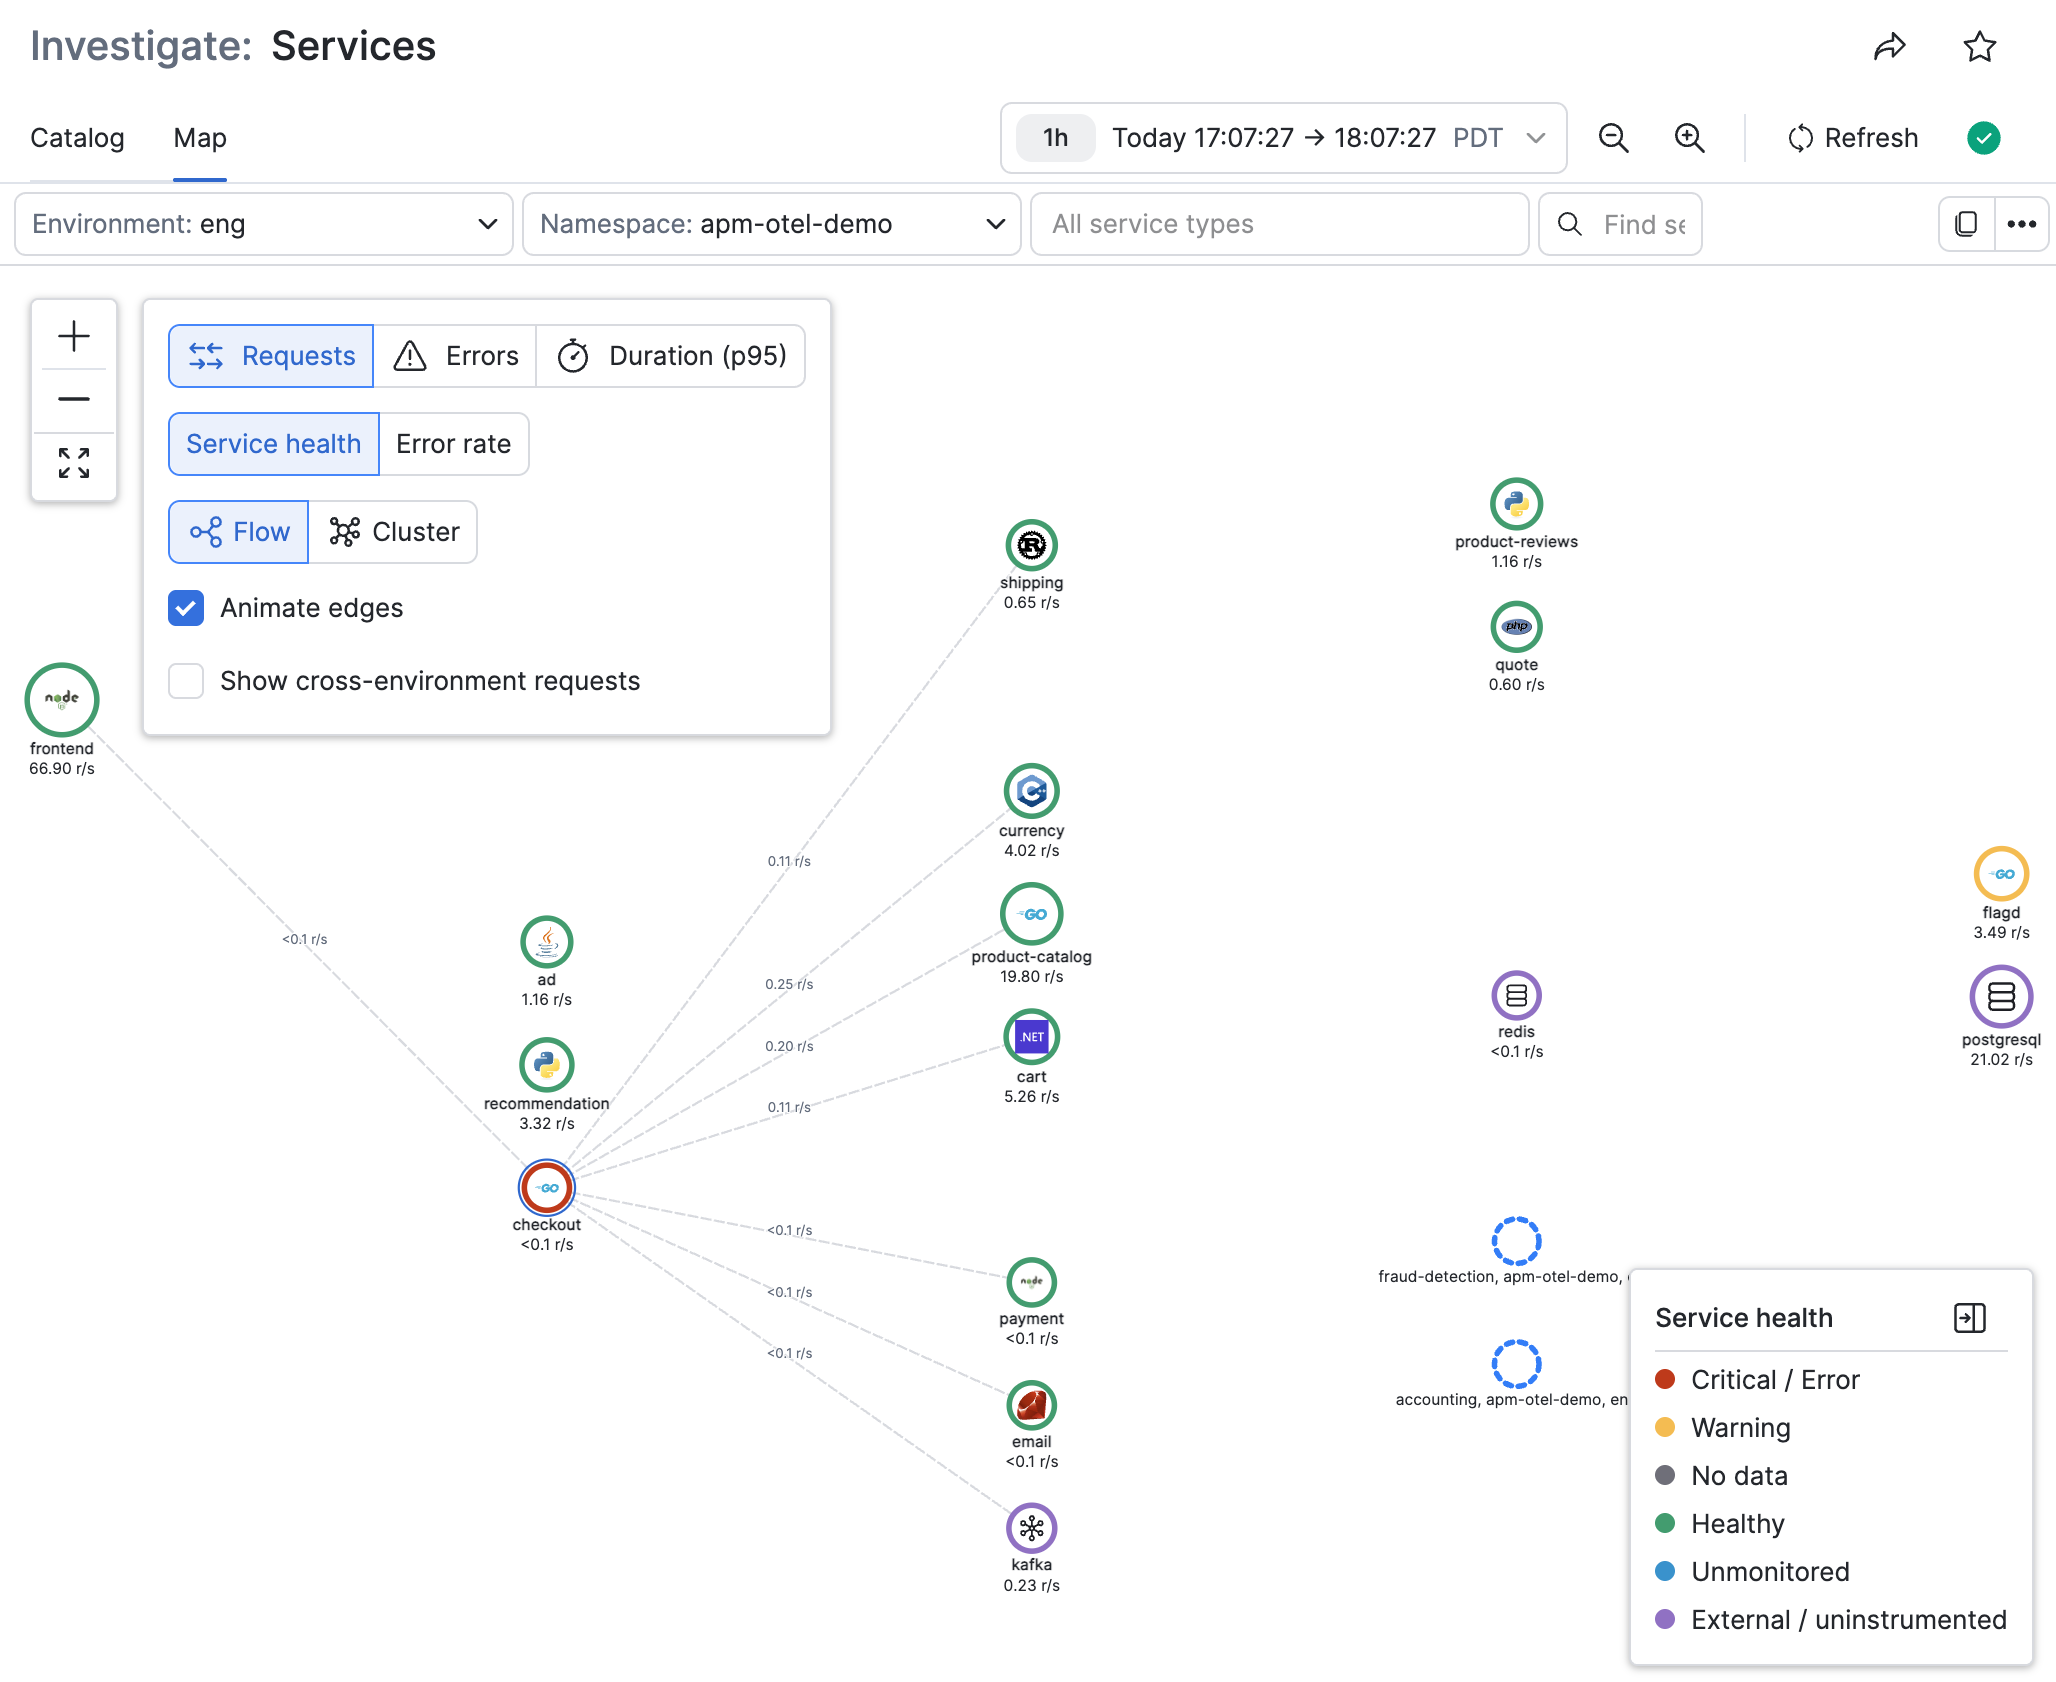
You can view the health of your services by checking your fleet on the Service Map to distinguish the services that have Monitors attached and their status. Look at the color of the nodes and the Service health status legend. The blue nodes don't have any Monitors attached to them:
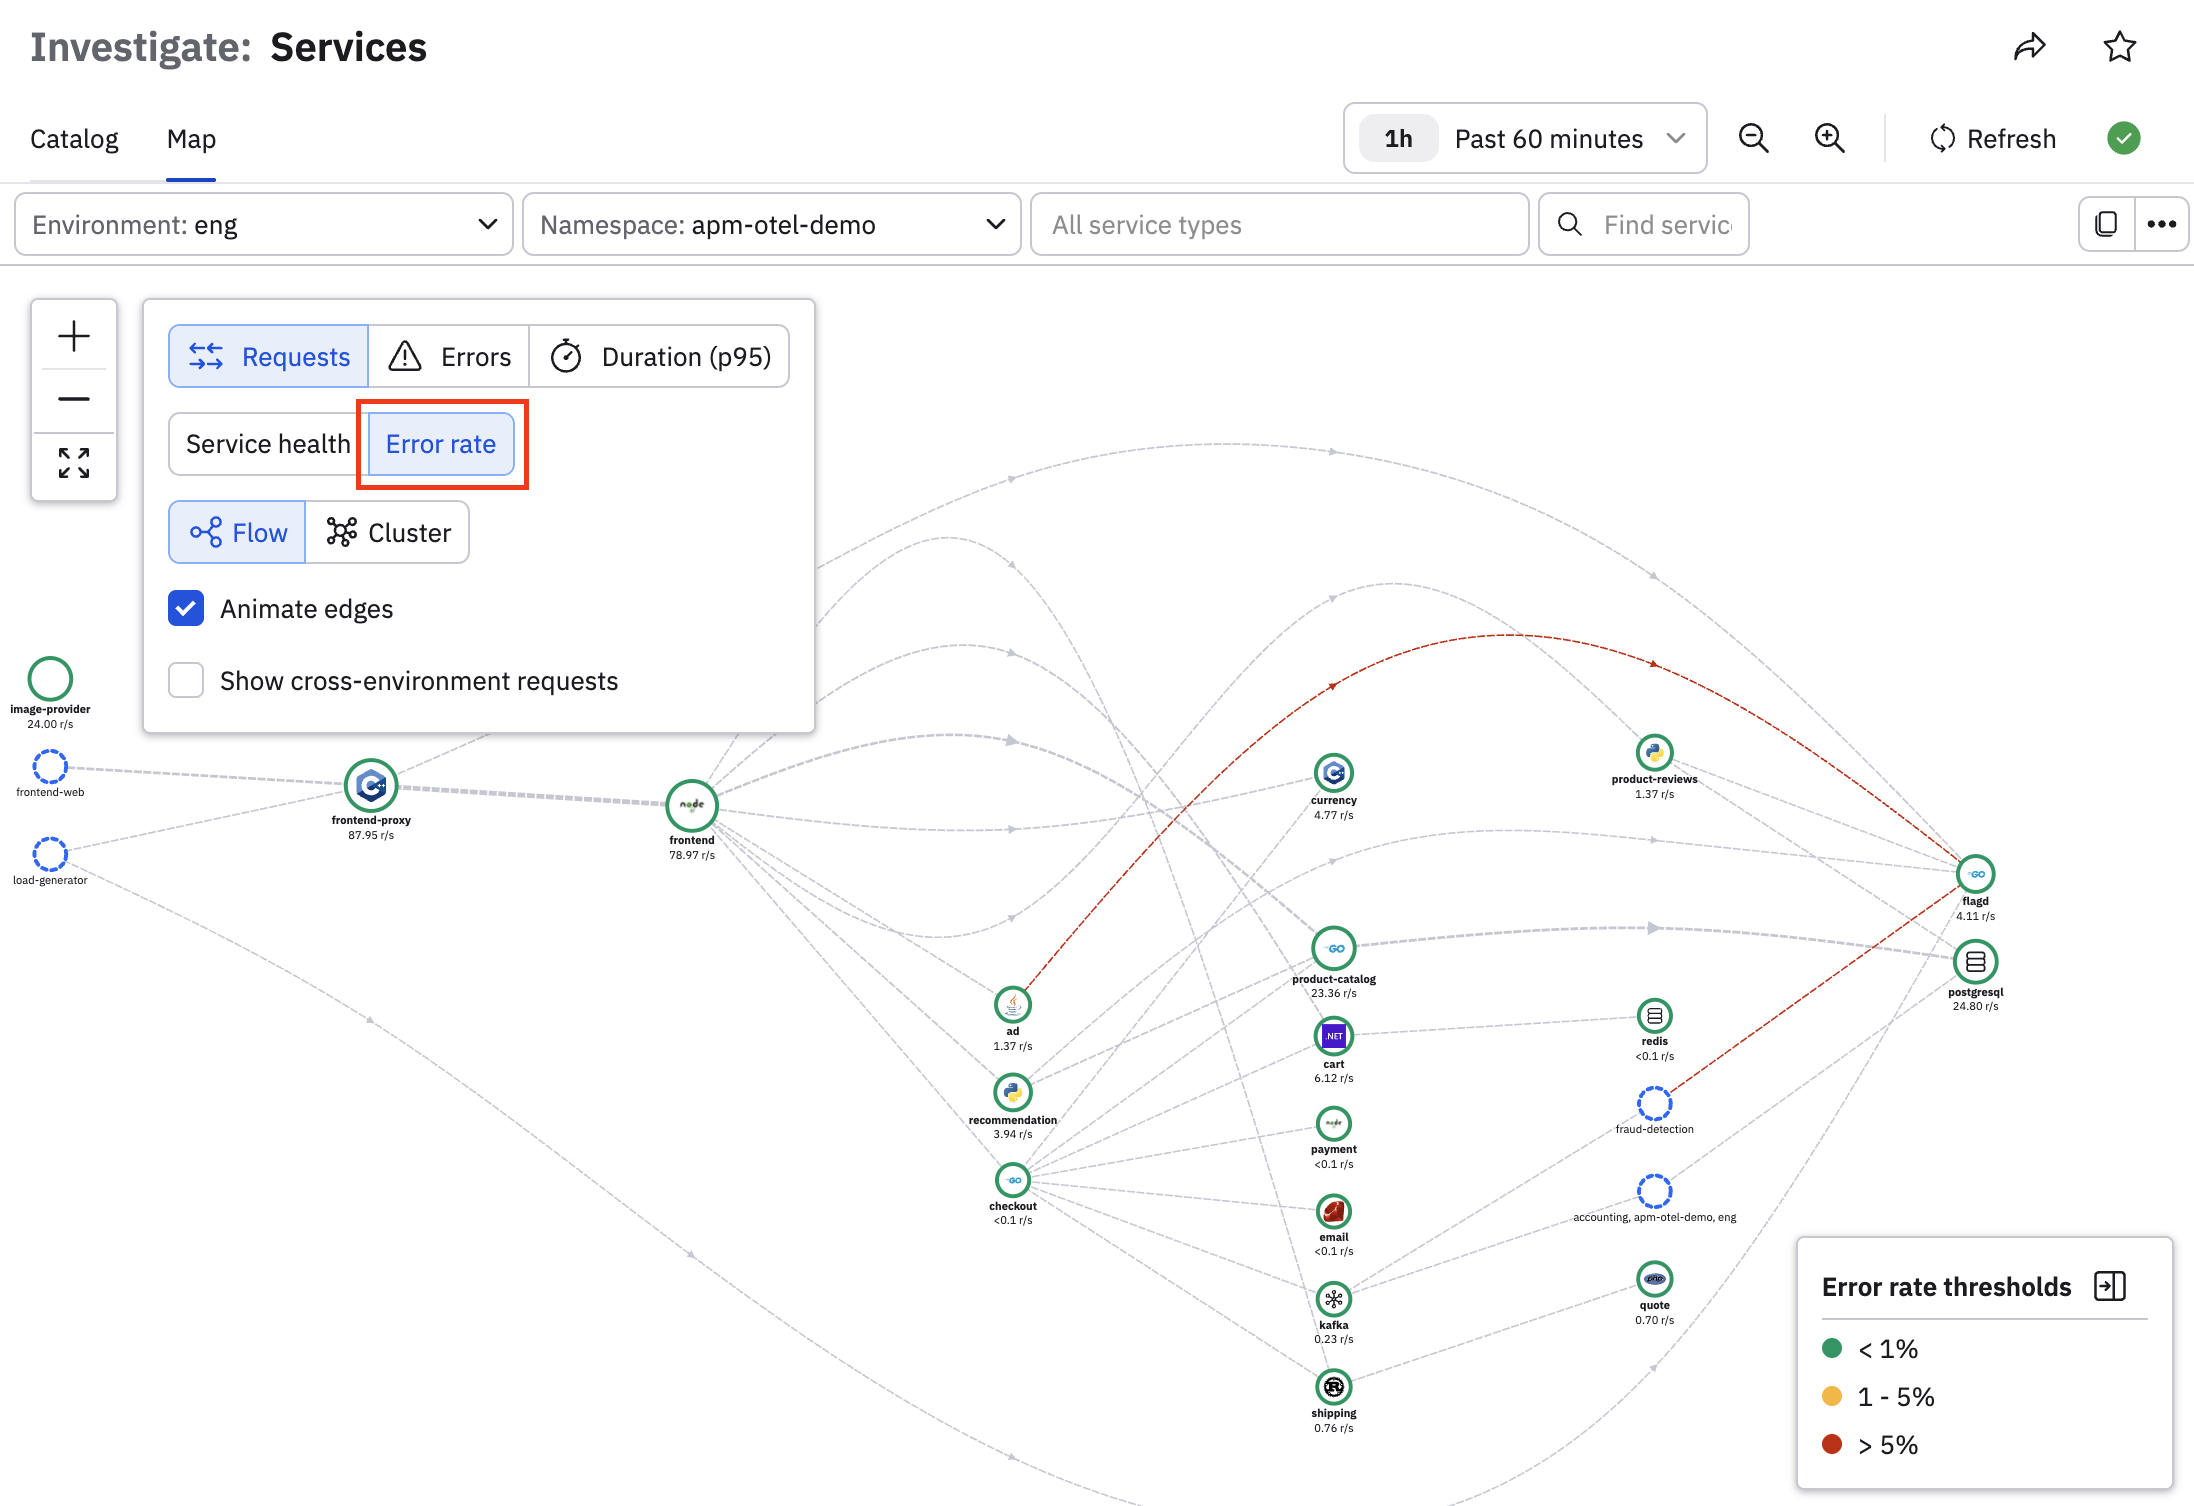
If you don't want to set any Monitors and want to see the static error rate thresholds instead, click Error rate to go back to the view with error rate thresholds:
Click on any service to create a focal view of the downstream edges, so that you can quickly see the furthest downstream service that is unhealthy. For example, let's click on the checkout node:
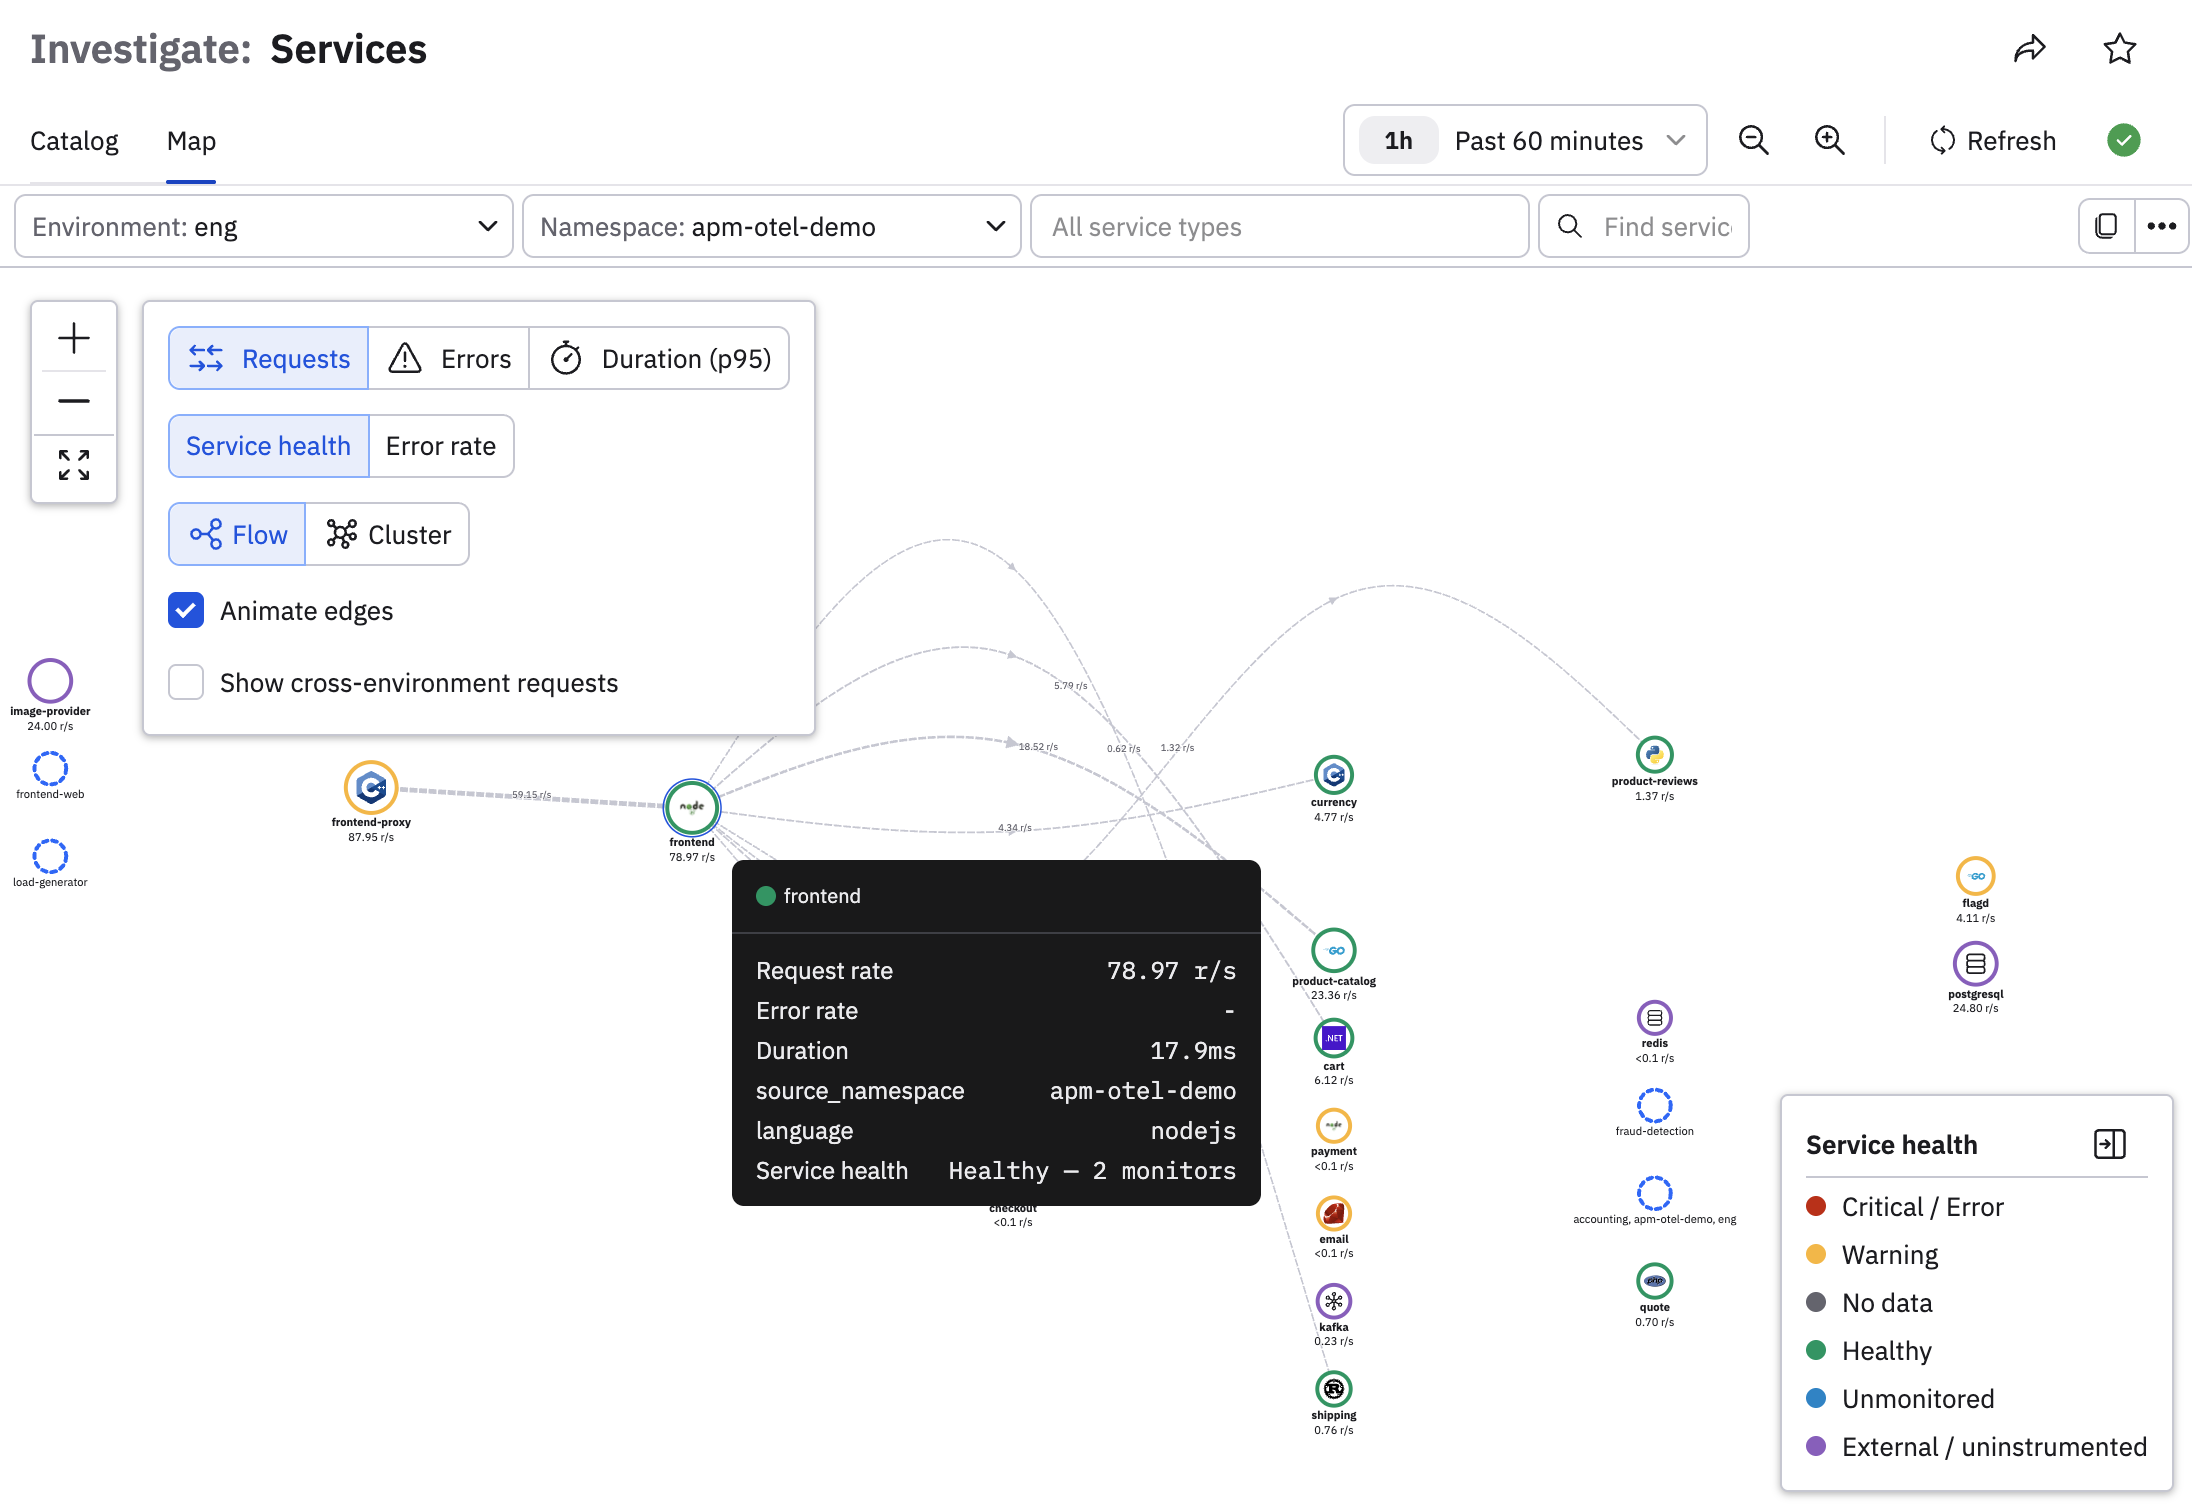
Hover on any service to see the explanation behind each service’s health condition. Here, we hover on the frontend service and see some of the stats, including that there are two Monitors tracking various aspects of the health of this service.
Double click on any service to drill down into the Service Inspector, or you can single click, then select Inspect service from the menu. In this case, we want to take a look at the checkout service that appears to be unhealthy:
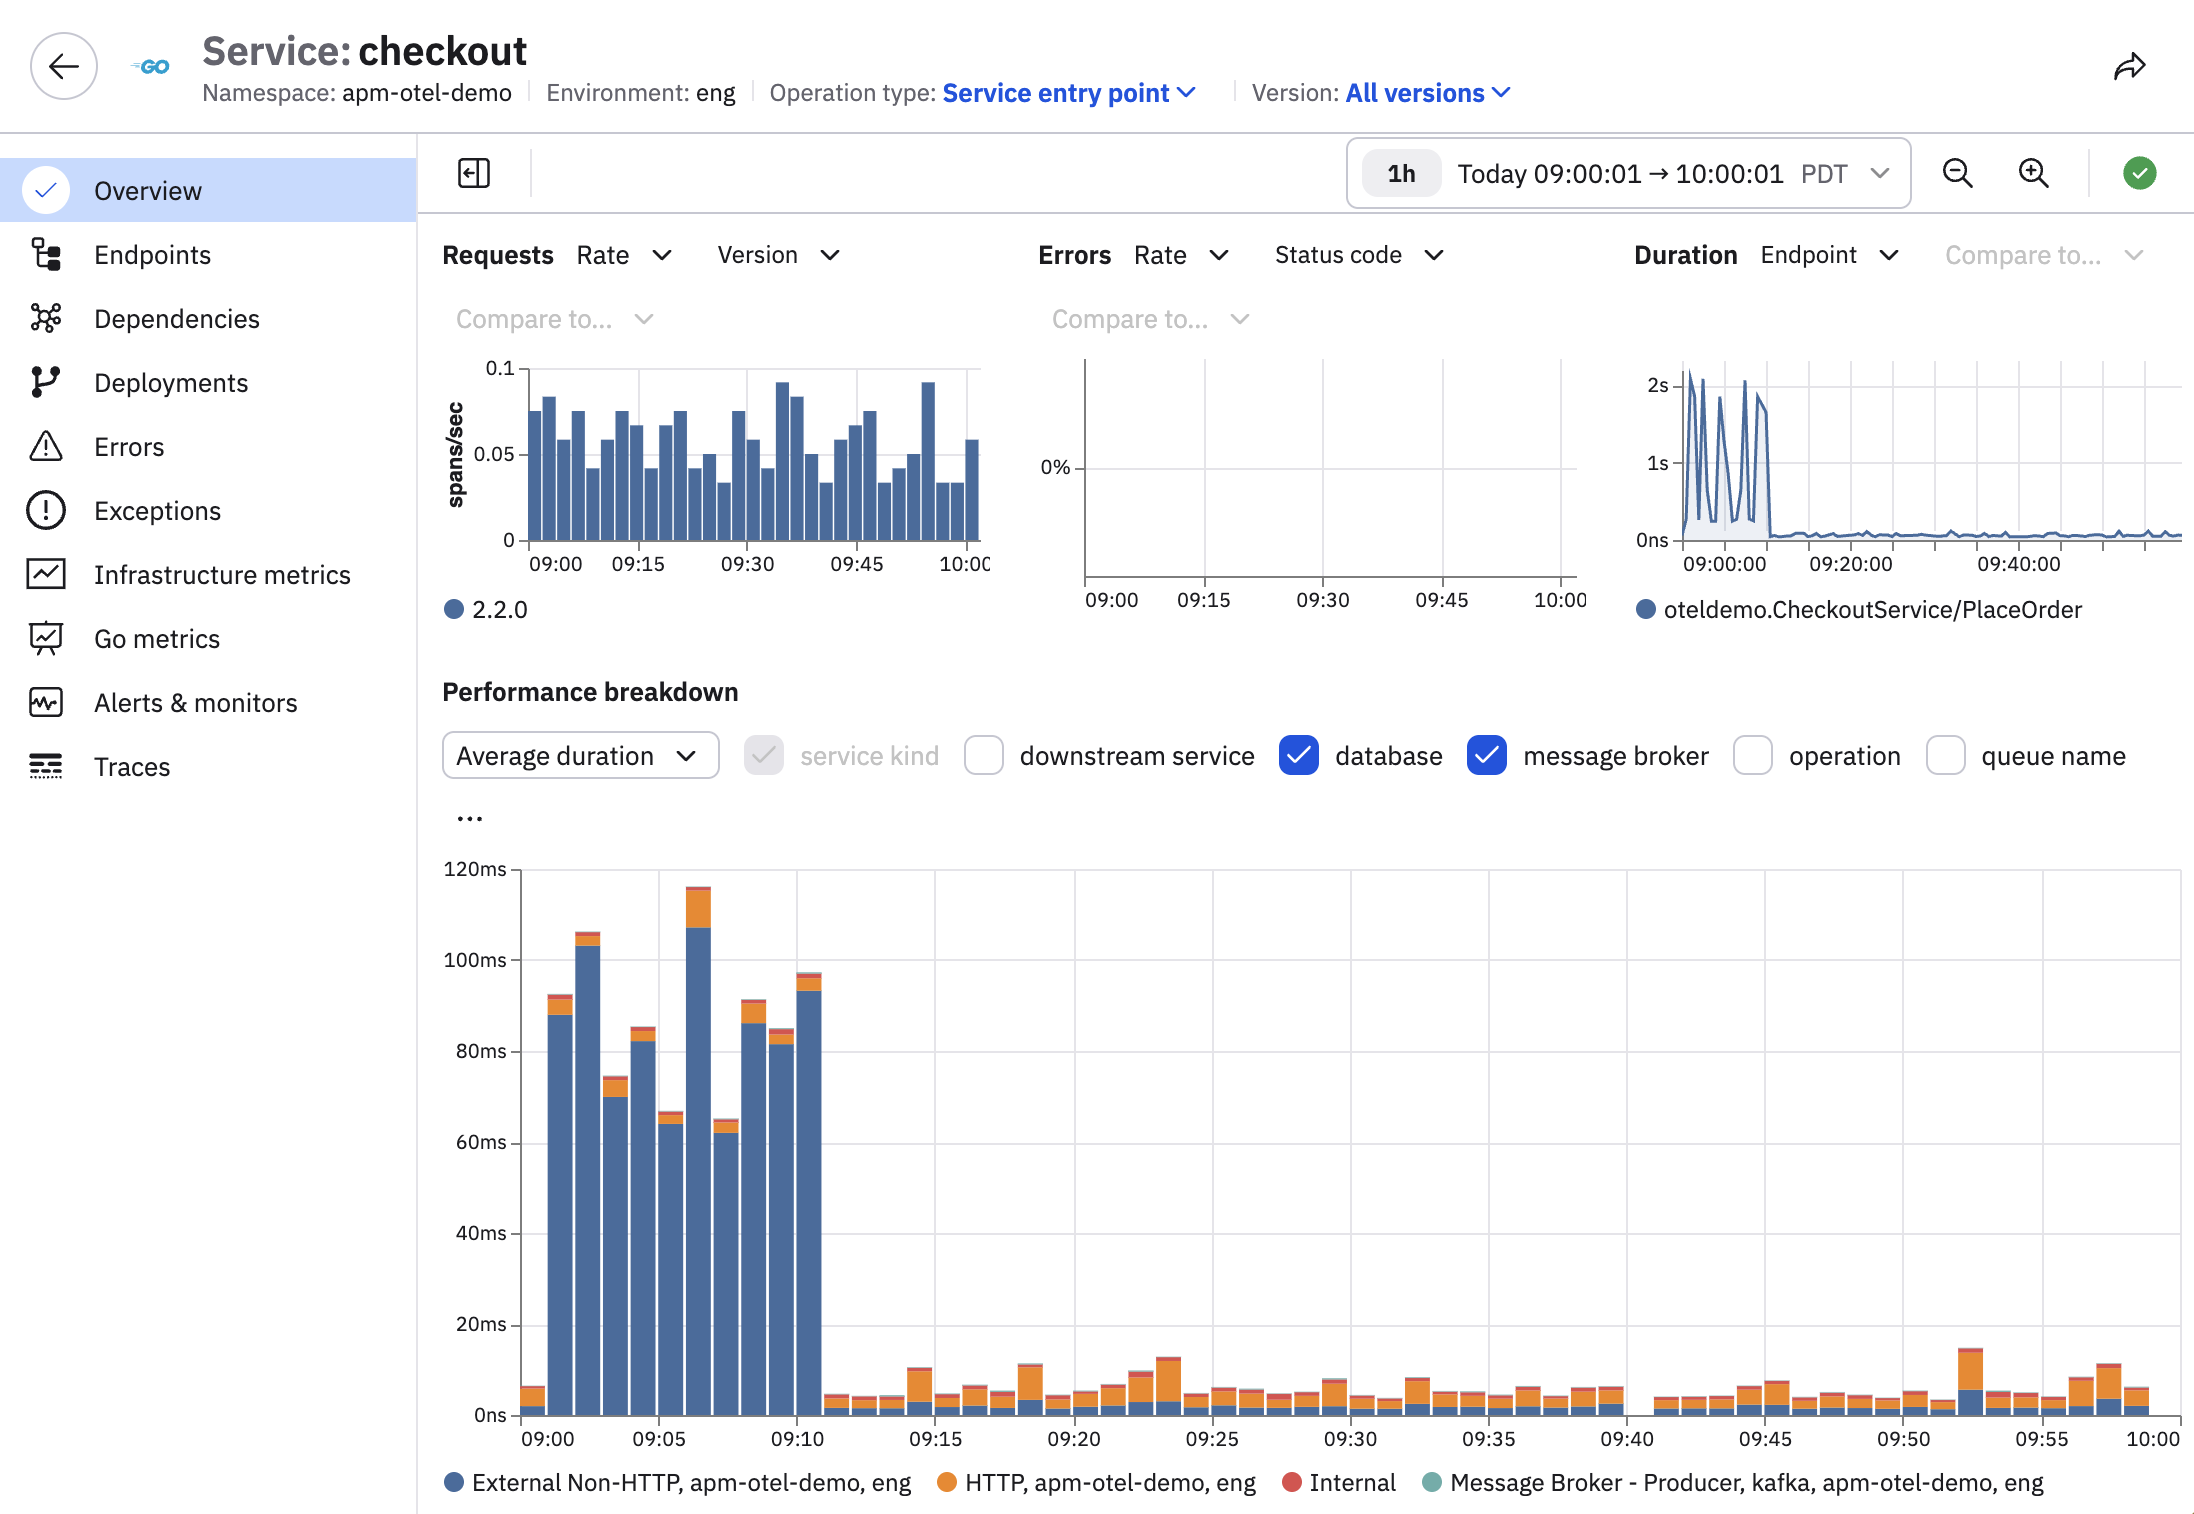
From the Service Inspector, you can view details about the service's health and the explanation behind its health status. In this example, we see there is an issue with some external non-HTTP service beginning around 09:00:
To view any associated alerts, runbooks, and Monitors, click the Alerts & monitors tab.
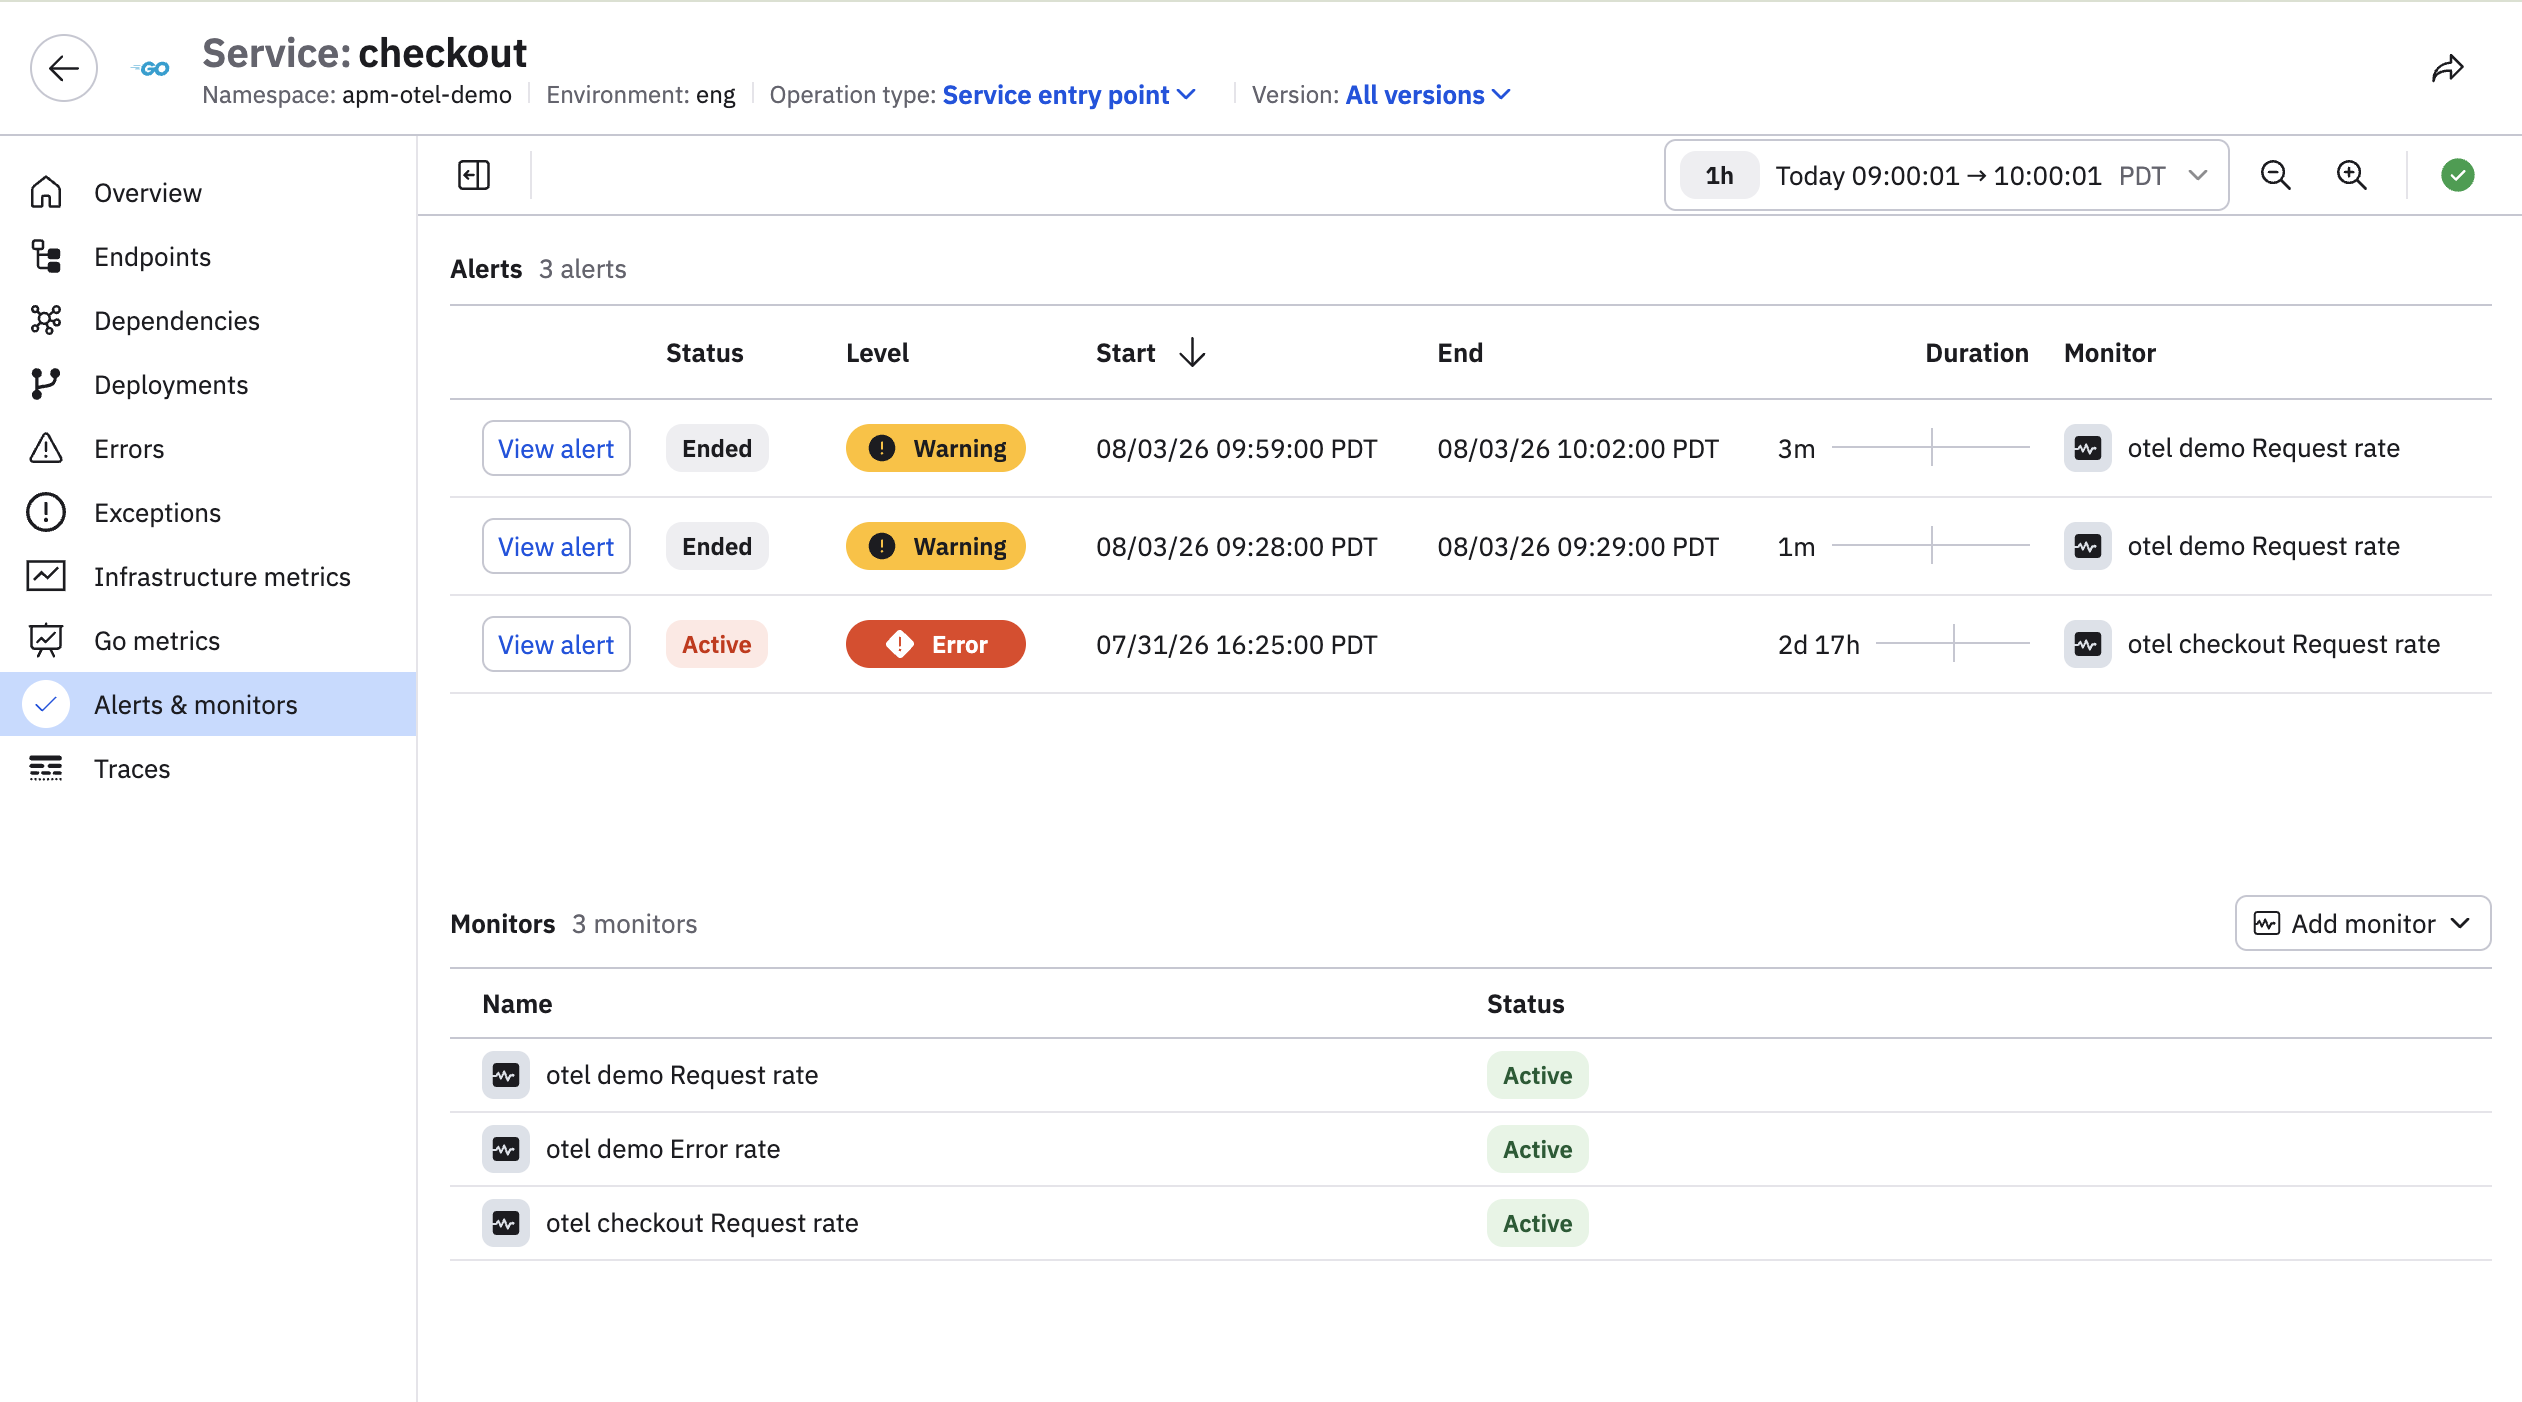
There are three active Monitors bound to this service. The otel checkout Request rate Monitor is still actively generating errors. So now, we can click View alert to get more details.
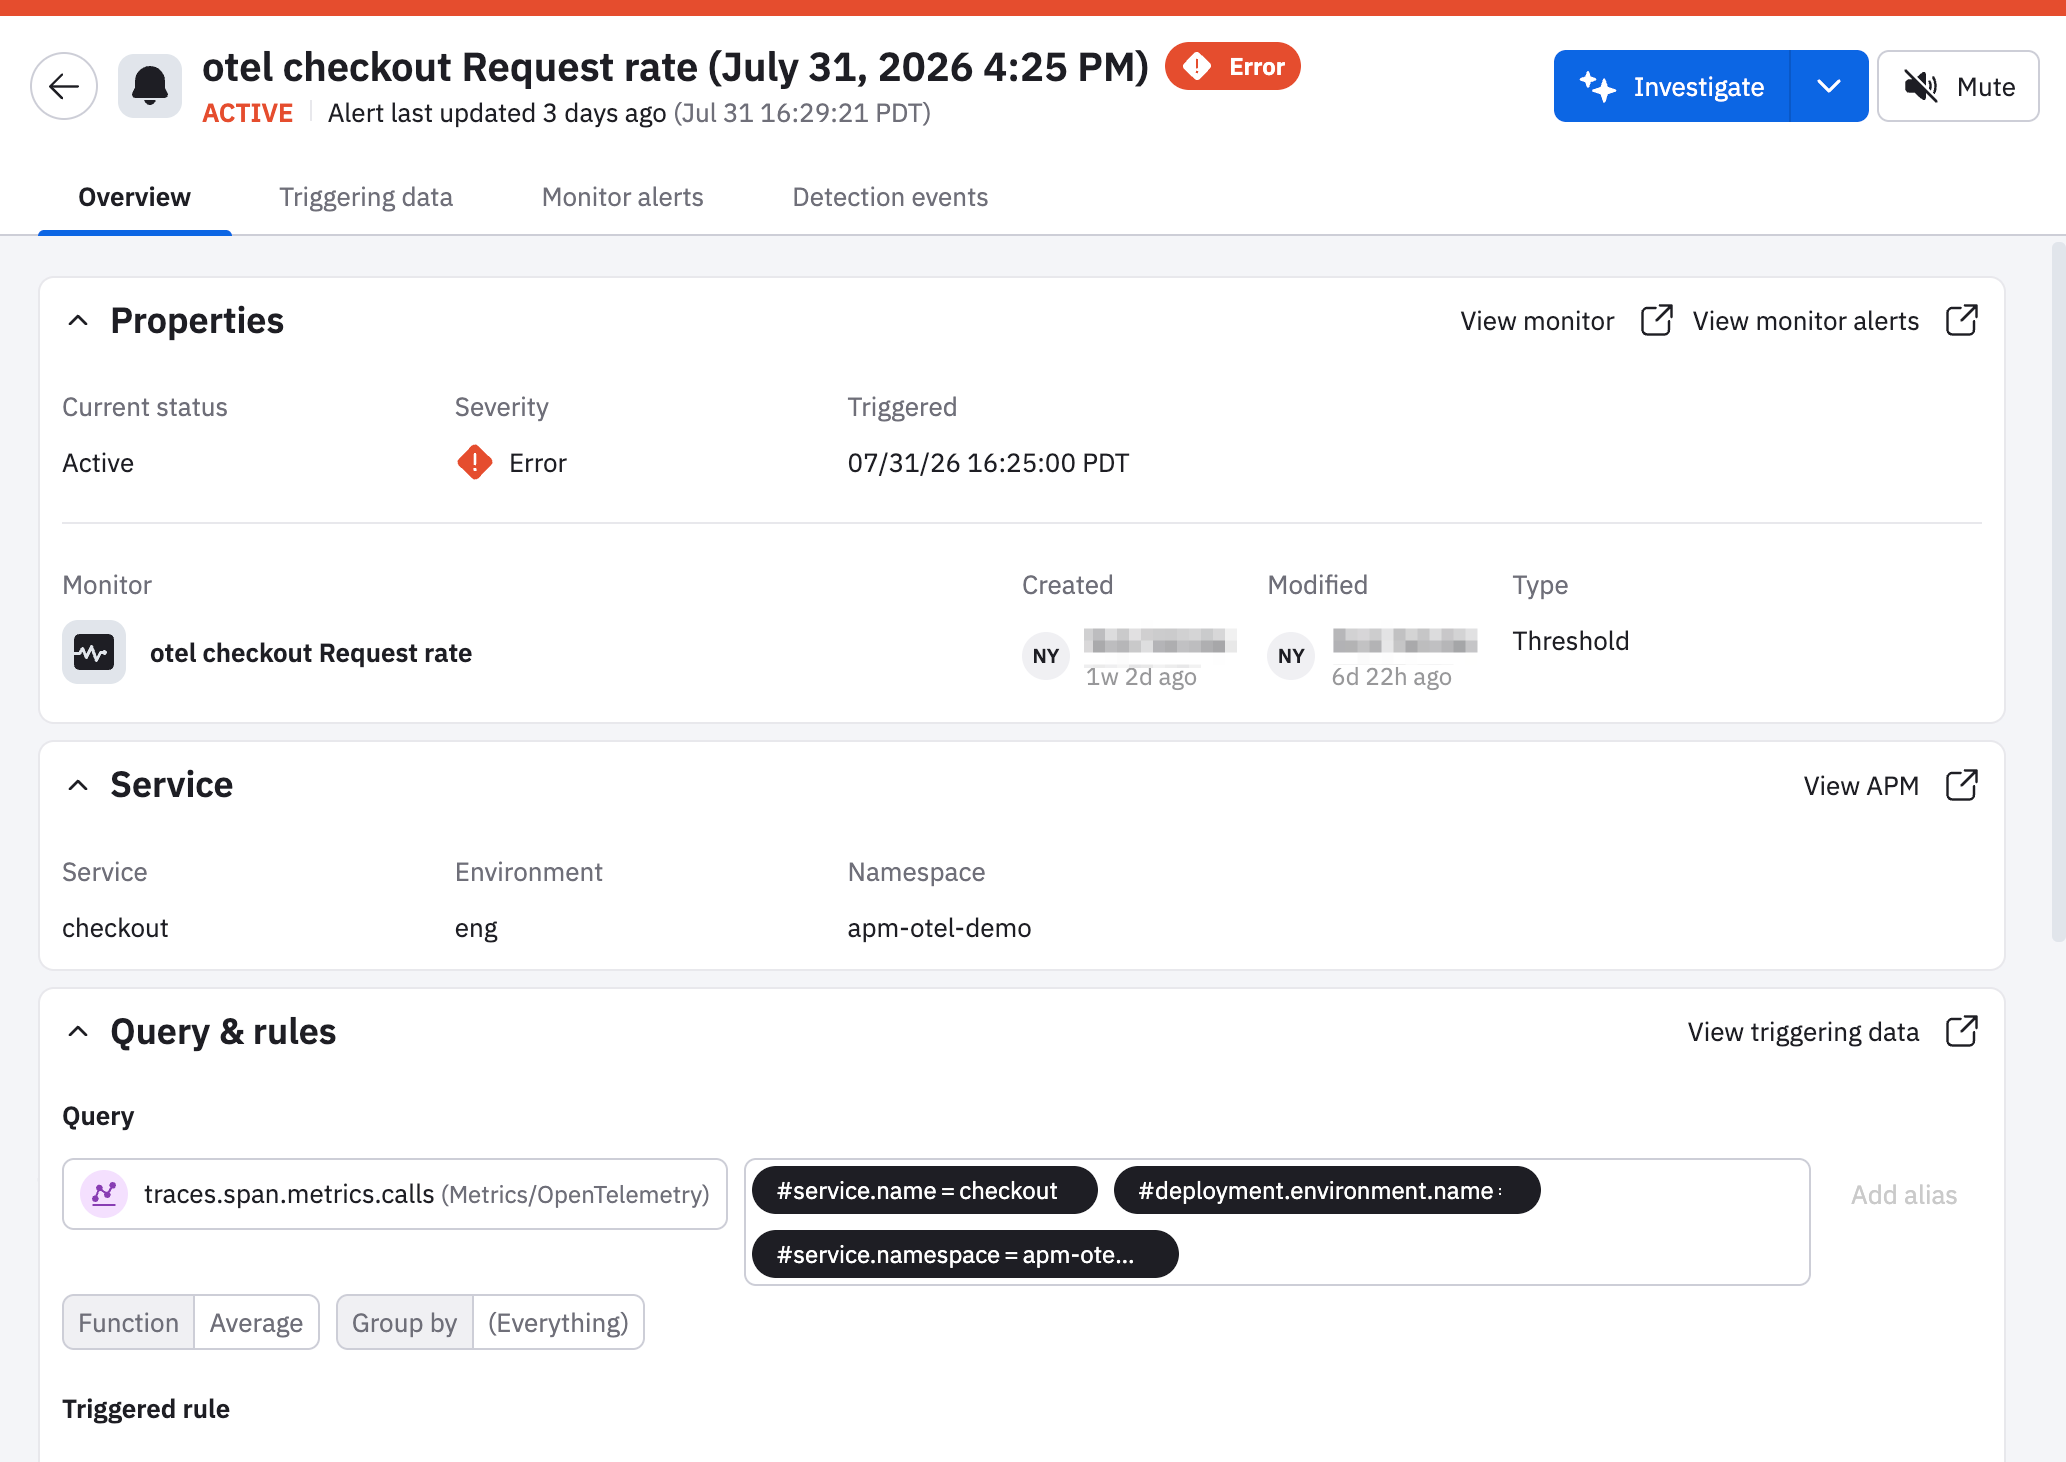
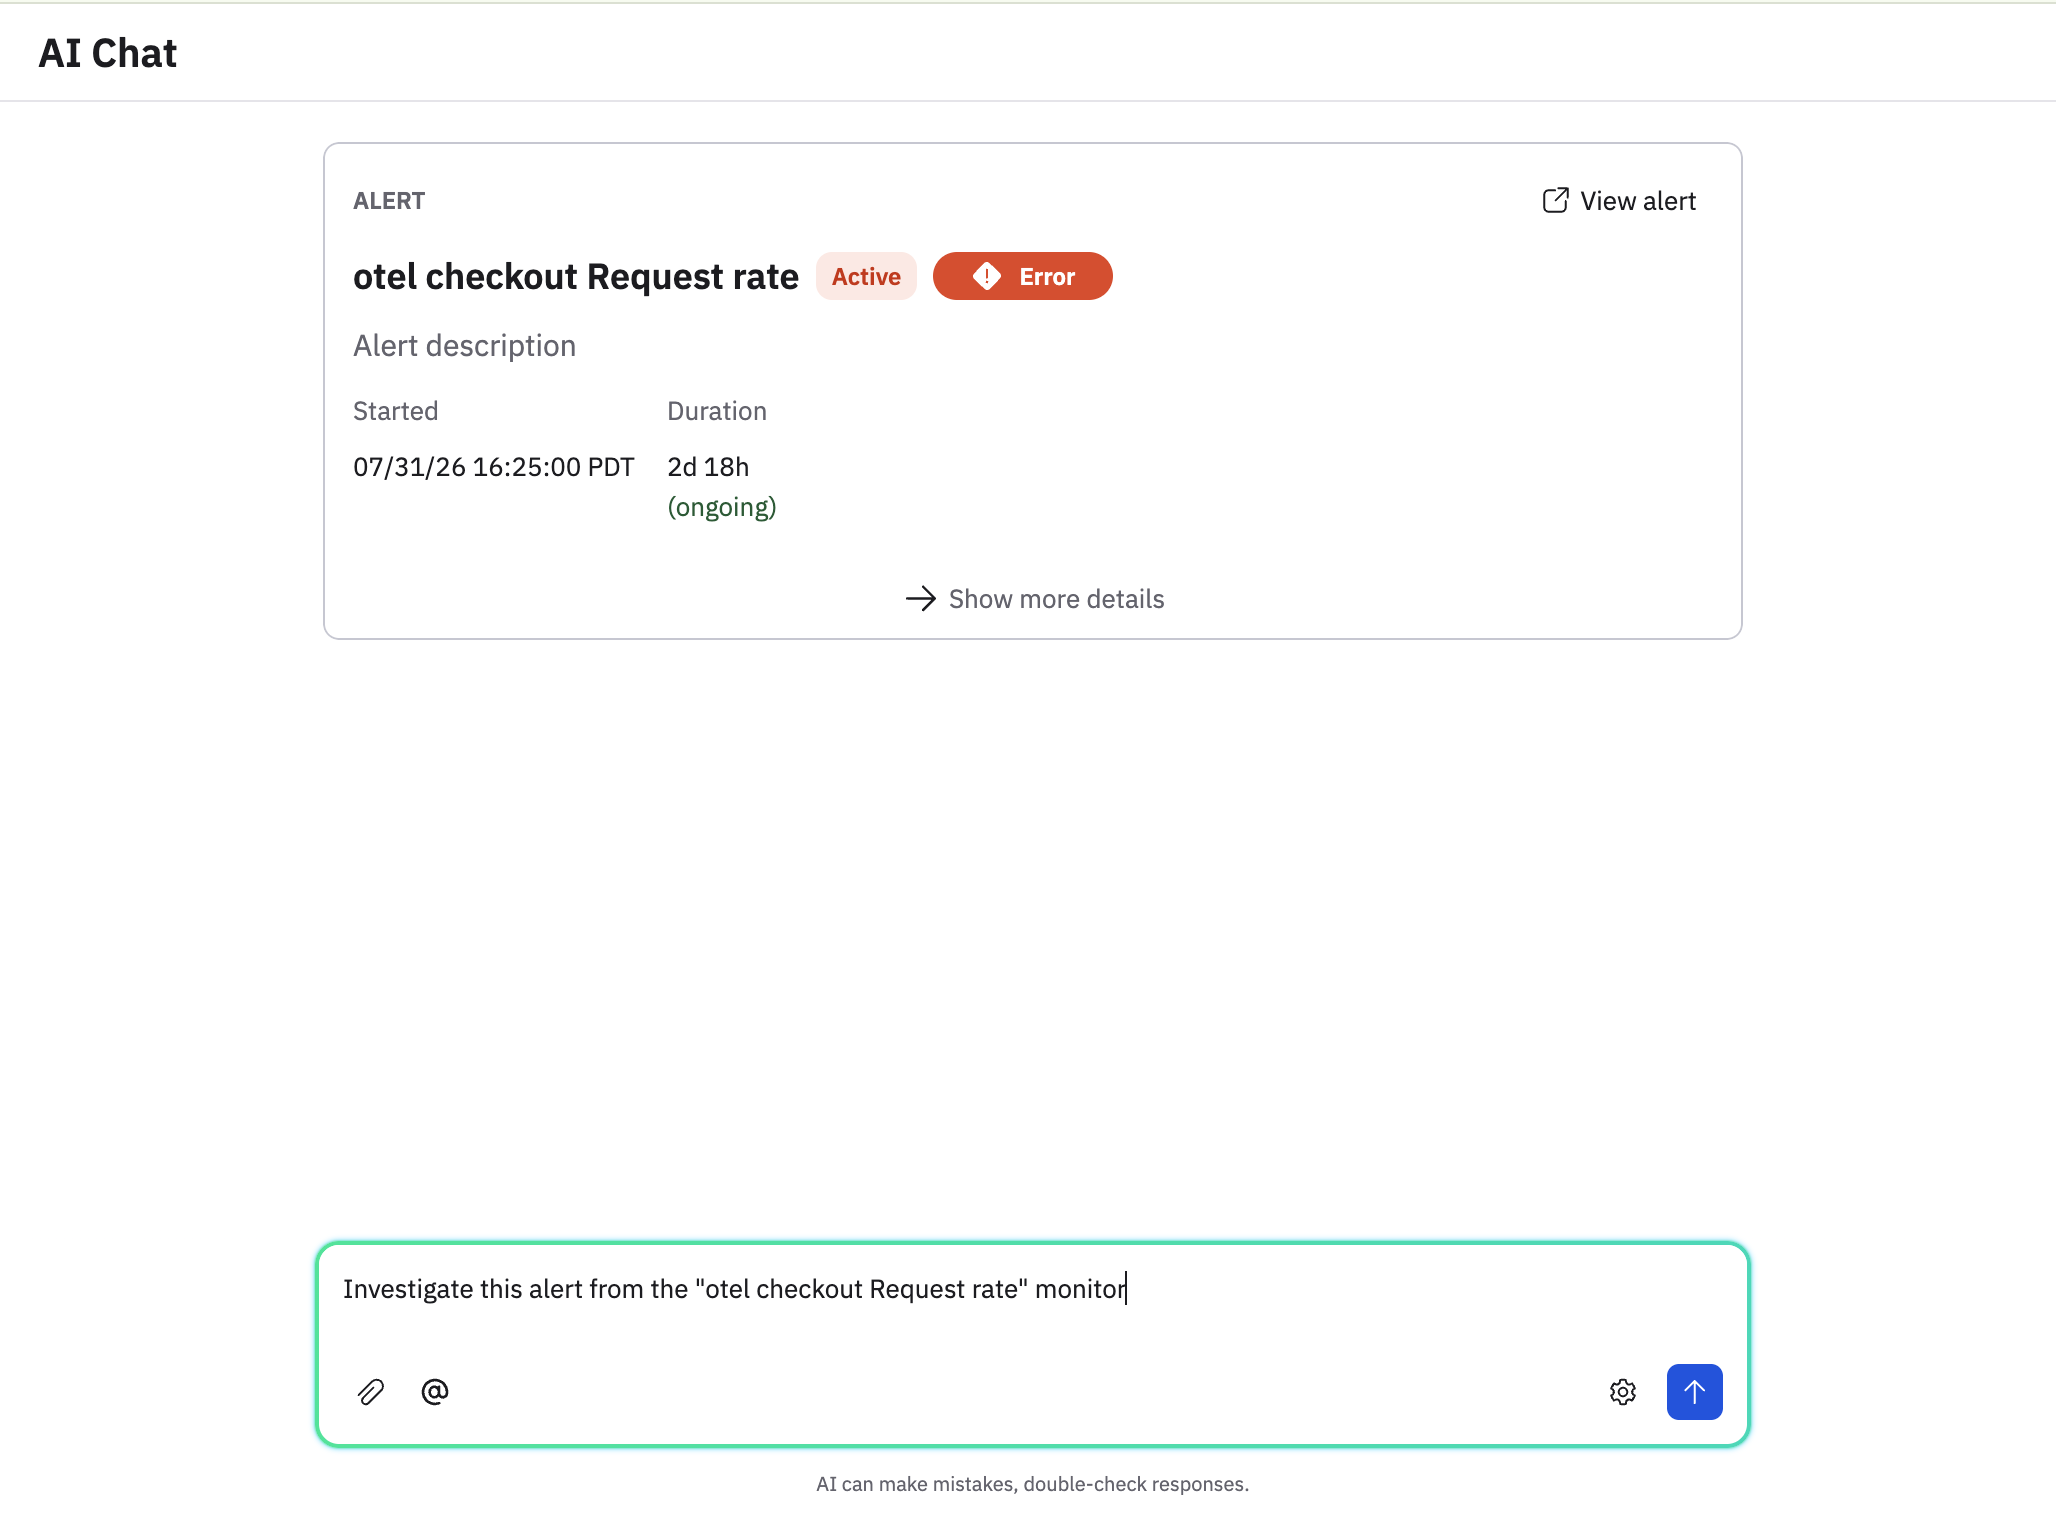
From the alert, click Investigate to use AI SRE and kick off an AI analysis of the issue.
Updated 2 days ago