

Inferred services
Observe by Snowflake infers databases, message brokers, and uninstrumented services from the spans your instrumented services send when they call out to them. They appear in APM alongside your instrumented services, so you can see your dependencies and how they perform without adding instrumentation to them.
How services are inferred
The following table summarizes how services are inferred.
| Service | Inferred from | Example |
|---|---|---|
| Database | Outbound client spans with database attributes such as db.system, db.operation, and db.statement. | PostgreSQL, MySQL, Redis, MongoDB |
| Message broker | Producer and consumer spans with messaging attributes such as messaging.system and messaging.destination.name for queue or topic level visibility. | Kafka, RabbitMQ, SQS |
| Uninstrumented service | Outbound remote spans with no matching span from the receiving service, identified by server.address. | Third-party APIs, legacy services, hosts not yet instrumented |
Inferred services only appear if an instrumented service calls them during the selected time range. Their RED metrics are measured from the caller's side, so they include network time and don't reflect what happens inside the service.
Where do inferred services appear?
Inferred services appear in the Service Maps, Database Inspector, Message Broker Inspector, and the Performance Breakdown chart.
Service Maps
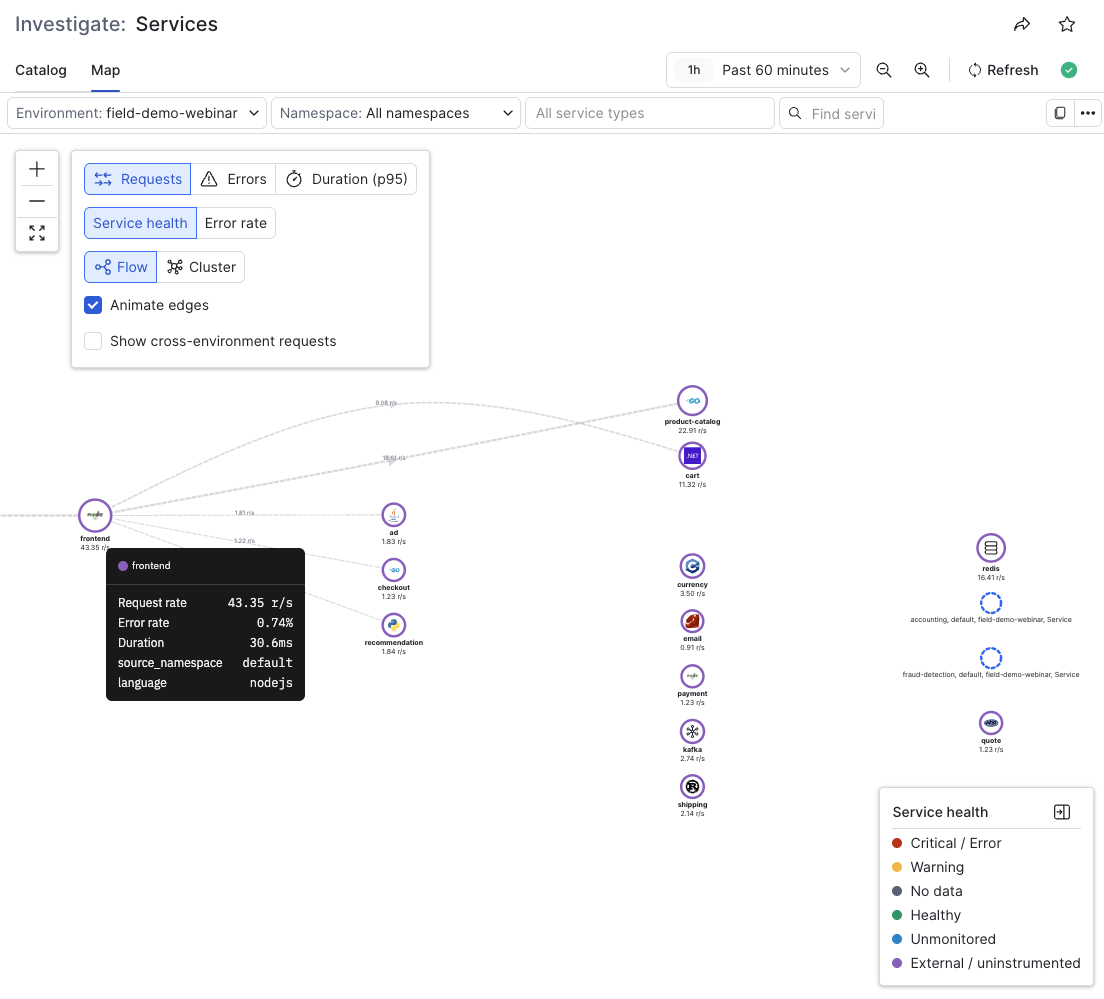
All node types appear on the global, dependency, and endpoint-scoped maps, with RED metrics on each node and edge. See every external system a service relies on.
Database Inspector
View the statements and operations run against each database, along with their latency and error rates.
Message Broker Inspector
Find the topics and queues each broker handles, and spot which ones are bottlenecks.
Performance breakdown chart
See how much of a service's time is spent waiting on databases, brokers, and external calls. Group by additional granularity like operation, queue, port.
Updated about 2 hours ago