

Debug a conversation
Learn how to use Agent Observability to debug a conversation.
Private preview feature (Invite only)This feature is enabled per tenant by Observe by Snowflake and is not generally available. To participate, contact your Observe by Snowflake representative. You may access and use this preview feature solely for internal evaluation purposes. Previews are provided as-is. Your use of this preview is subject to the Snowflake Preview Terms located at https://www.snowflake.com/en/legal.
Suppose you are an agent developer, and you want to investigate and debug a conversation that did not give you the results or answers you were expecting.
Begin by access the Agent Explorer. Click AI Agents in the left navigation to access the AI Agent Explorer.
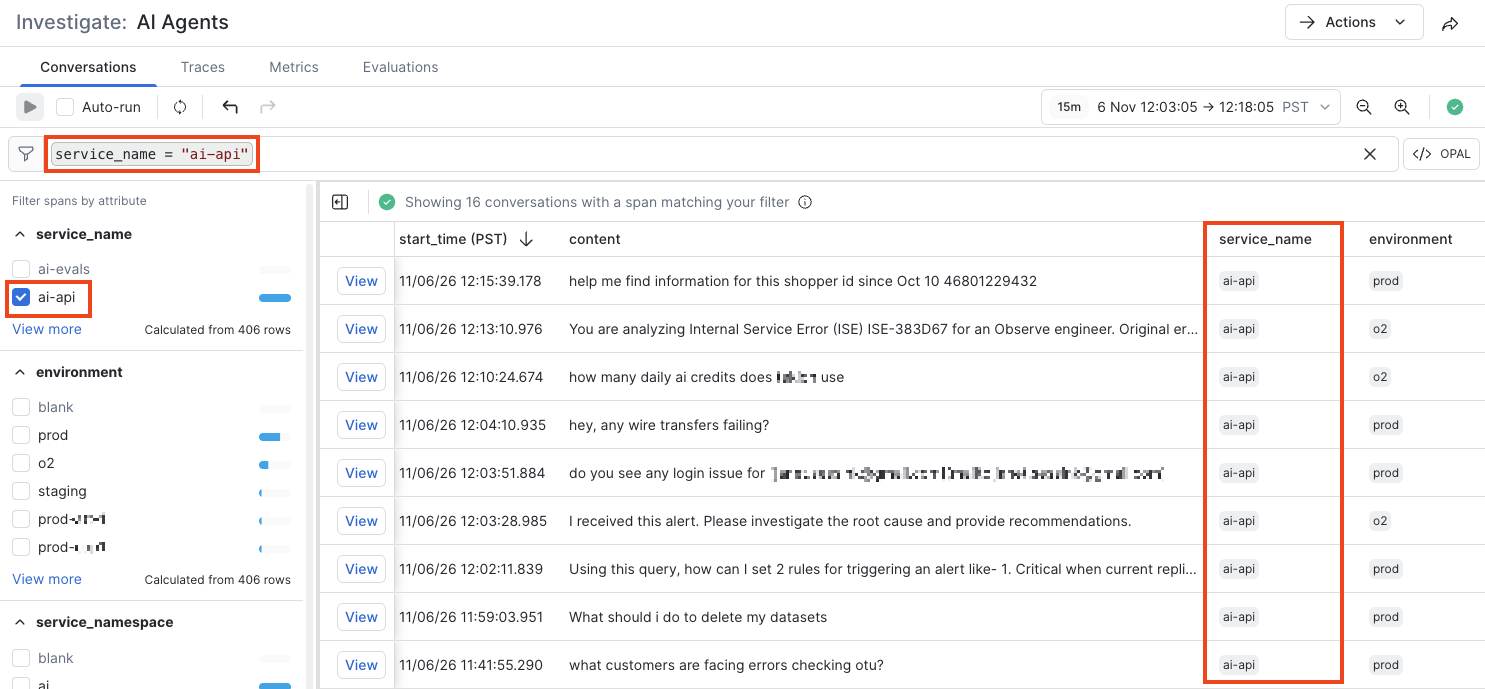
To help you find the conversation you want, you can use the filter panel or type directly in the filter bar. For example, click ai-api in the service_name section to find only those conversations using ai-api as the service. The filter bar is also automatically populated with this value:
Other ways to find specific conversations are to use a conversation ID, or search for some content in the conversation itself. For example, suppose we want to find the conversations with errors in them. We can type the following filter to capture the word error on both the input (user input) and output (AI SRE response):
#content.input ~ error or #content.output ~ error 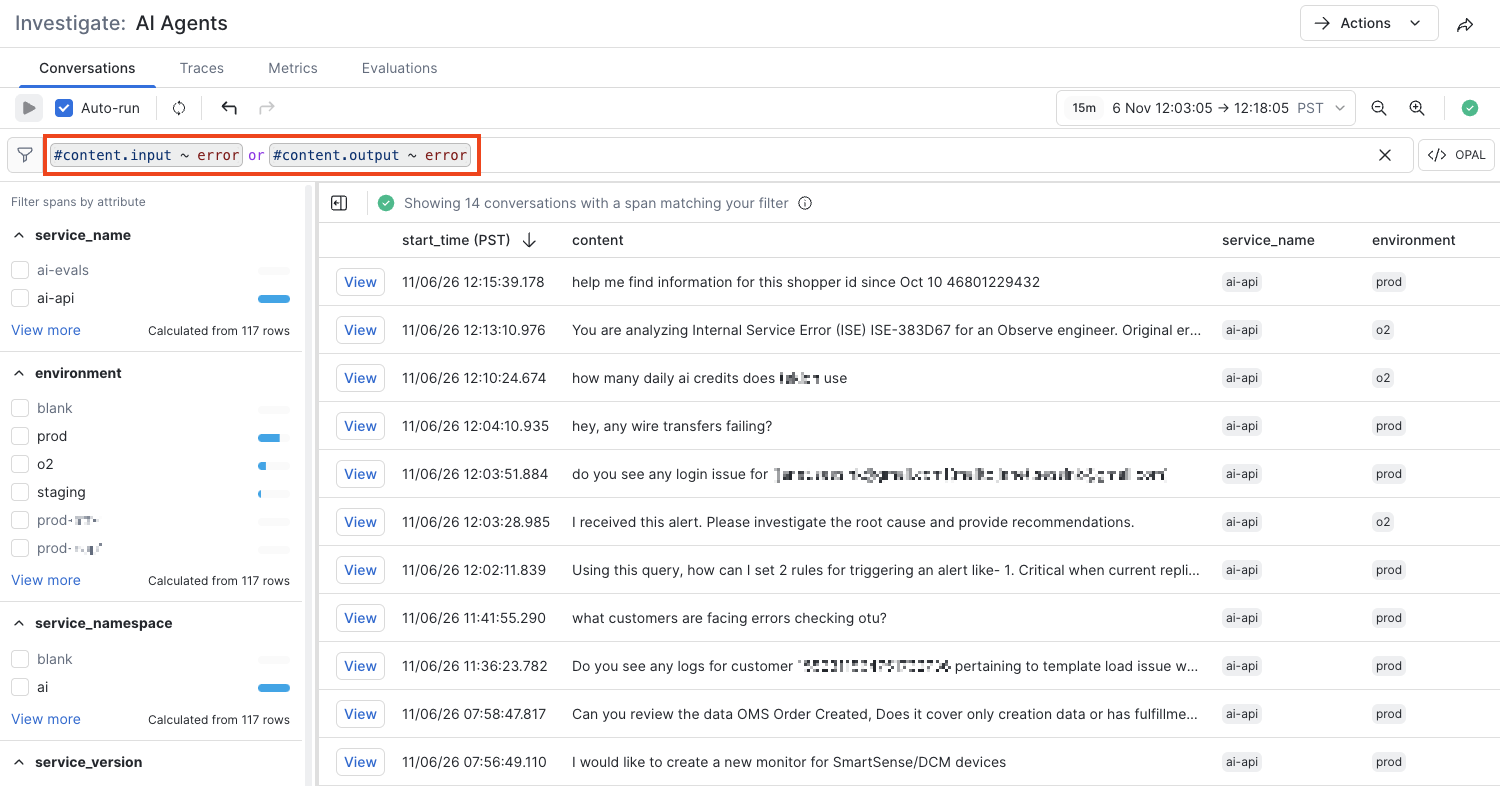
From the list of results, we can click View on the conversation we want to examine.
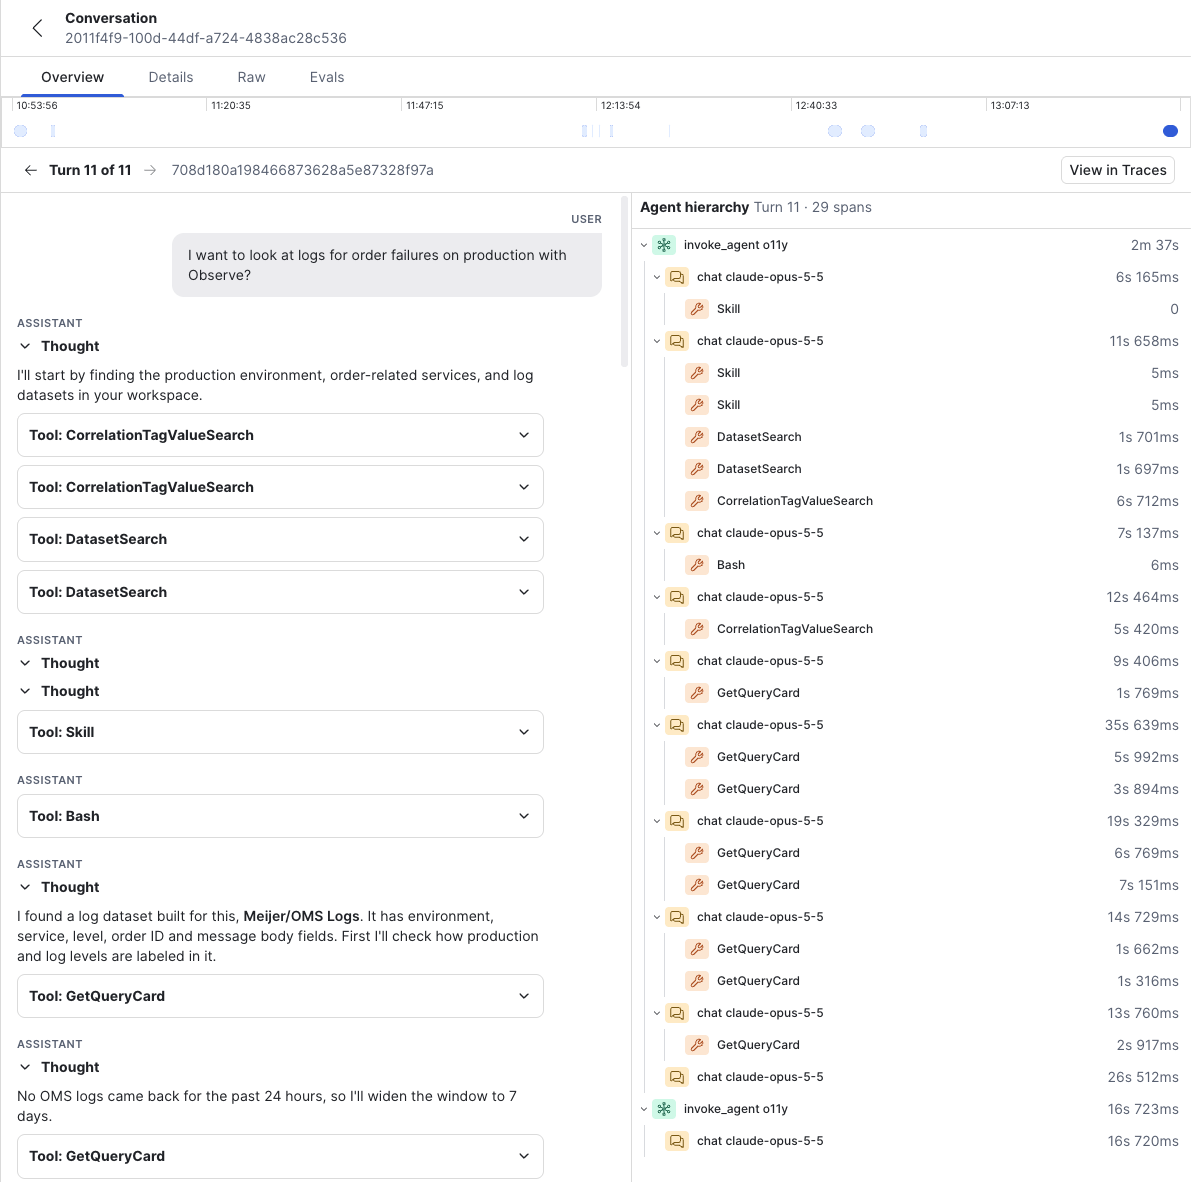
Each conversation is a list of turns. Each turn starts from the user prompt, and ends with the agent's response. One turn is captured in one trace.
Click the left and right arrow icons next to Turn 11 of 11 in this example to view each turn.
When you find the turn you want to investigate, click View in Traces to examine the individual spans in that trace.
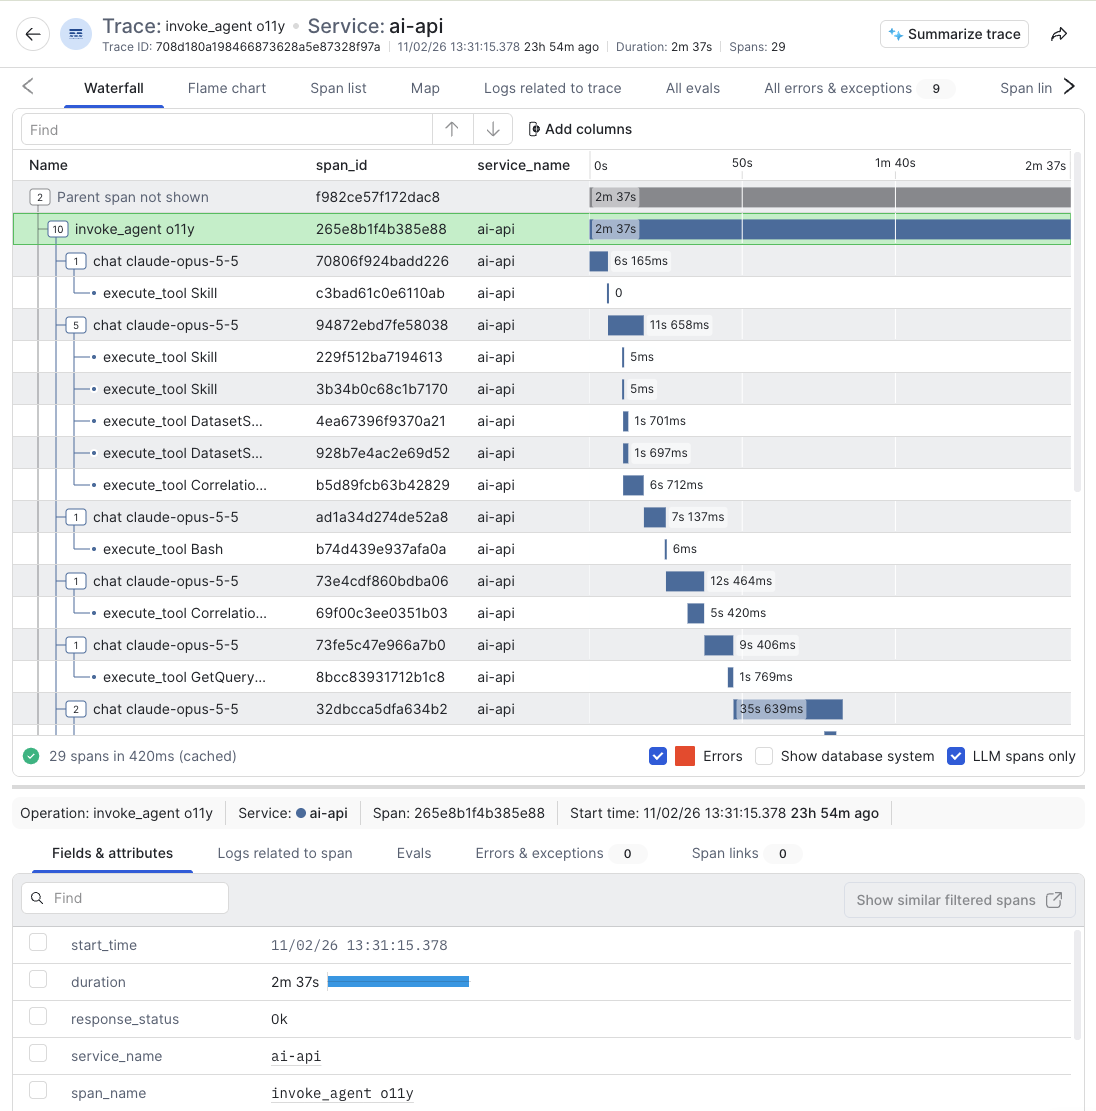
Each spans runs in the order the agent worked: the agent span, then each tool call, then the model call that produced the answer.
| What you are checking | Where it is |
|---|---|
| What the user asked | Input on the model span. |
| What the model answered | Output on the model span. |
| Which tool ran, with which arguments, and what it returned | The tool span. The name, arguments, and result are on the span. |
| Whether the call failed | response_status is Error on that span. |
Here is an example showing the input and output on a span:
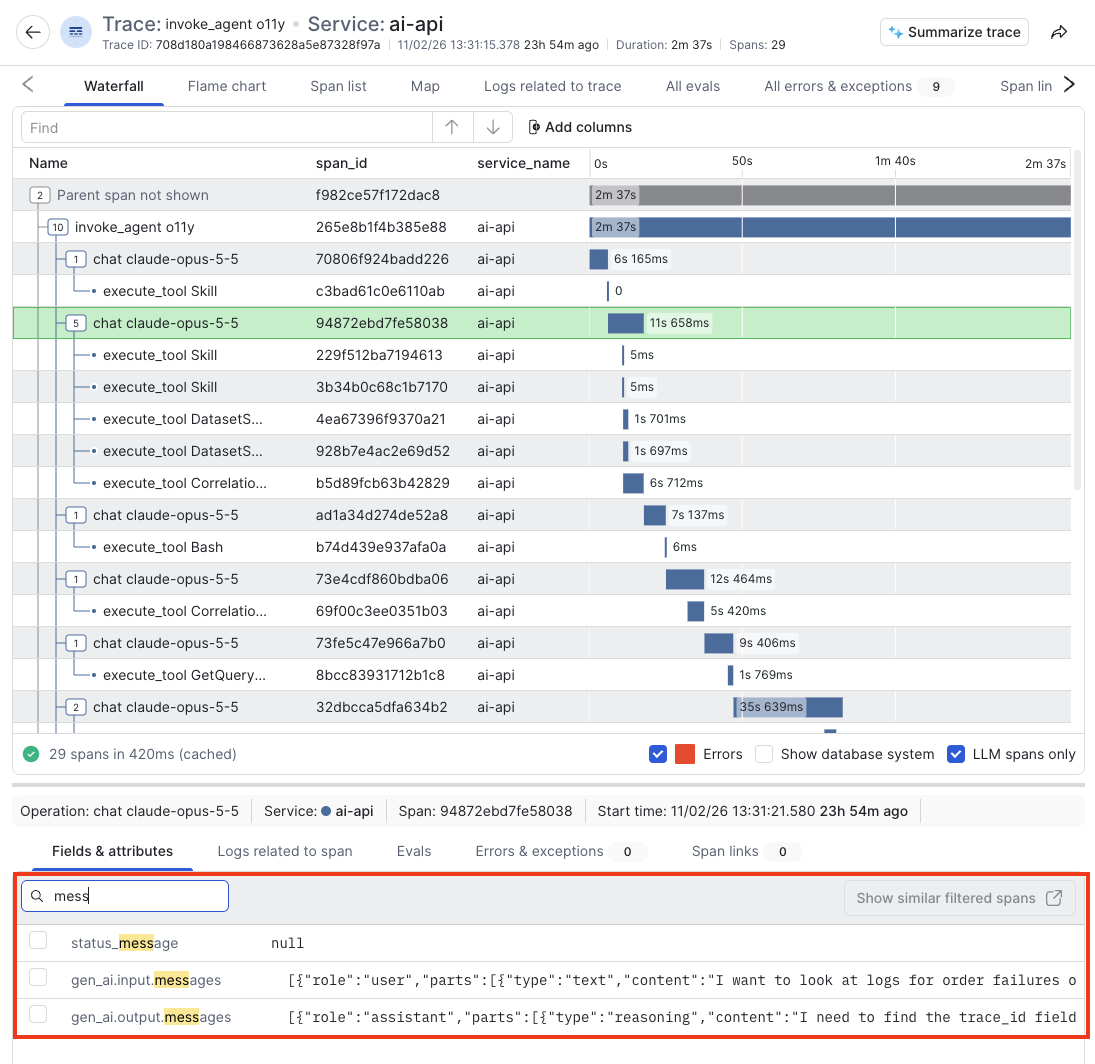
Prompts and tool payloads are present only if you turned on content capture in Instrument your agents.
Updated 36 minutes ago