

Monitor your agent activity
Private preview feature (Invite only)This feature is enabled per tenant by Observe by Snowflake and is not generally available. To participate, contact your Observe by Snowflake representative. You may access and use this preview feature solely for internal evaluation purposes. Previews are provided as-is. Your use of this preview is subject to the Snowflake Preview Terms located at https://www.snowflake.com/en/legal.
In this example, we'll use the Metrics tab to find a problem with your agents, then turn that chart into a Monitor. The next time the same problem happens, you get an alert without watching the dashboard.
The o11y agent fails in a short burst. You'll find the burst on the Metrics tab, check the query behind it, and create a Monitor that alerts on the same condition.
Begin by clicking AI Agents in the left navigation, then click the Metrics tab. On this page, you can view a summary of your agent health, model usage, token usage, and tools called.
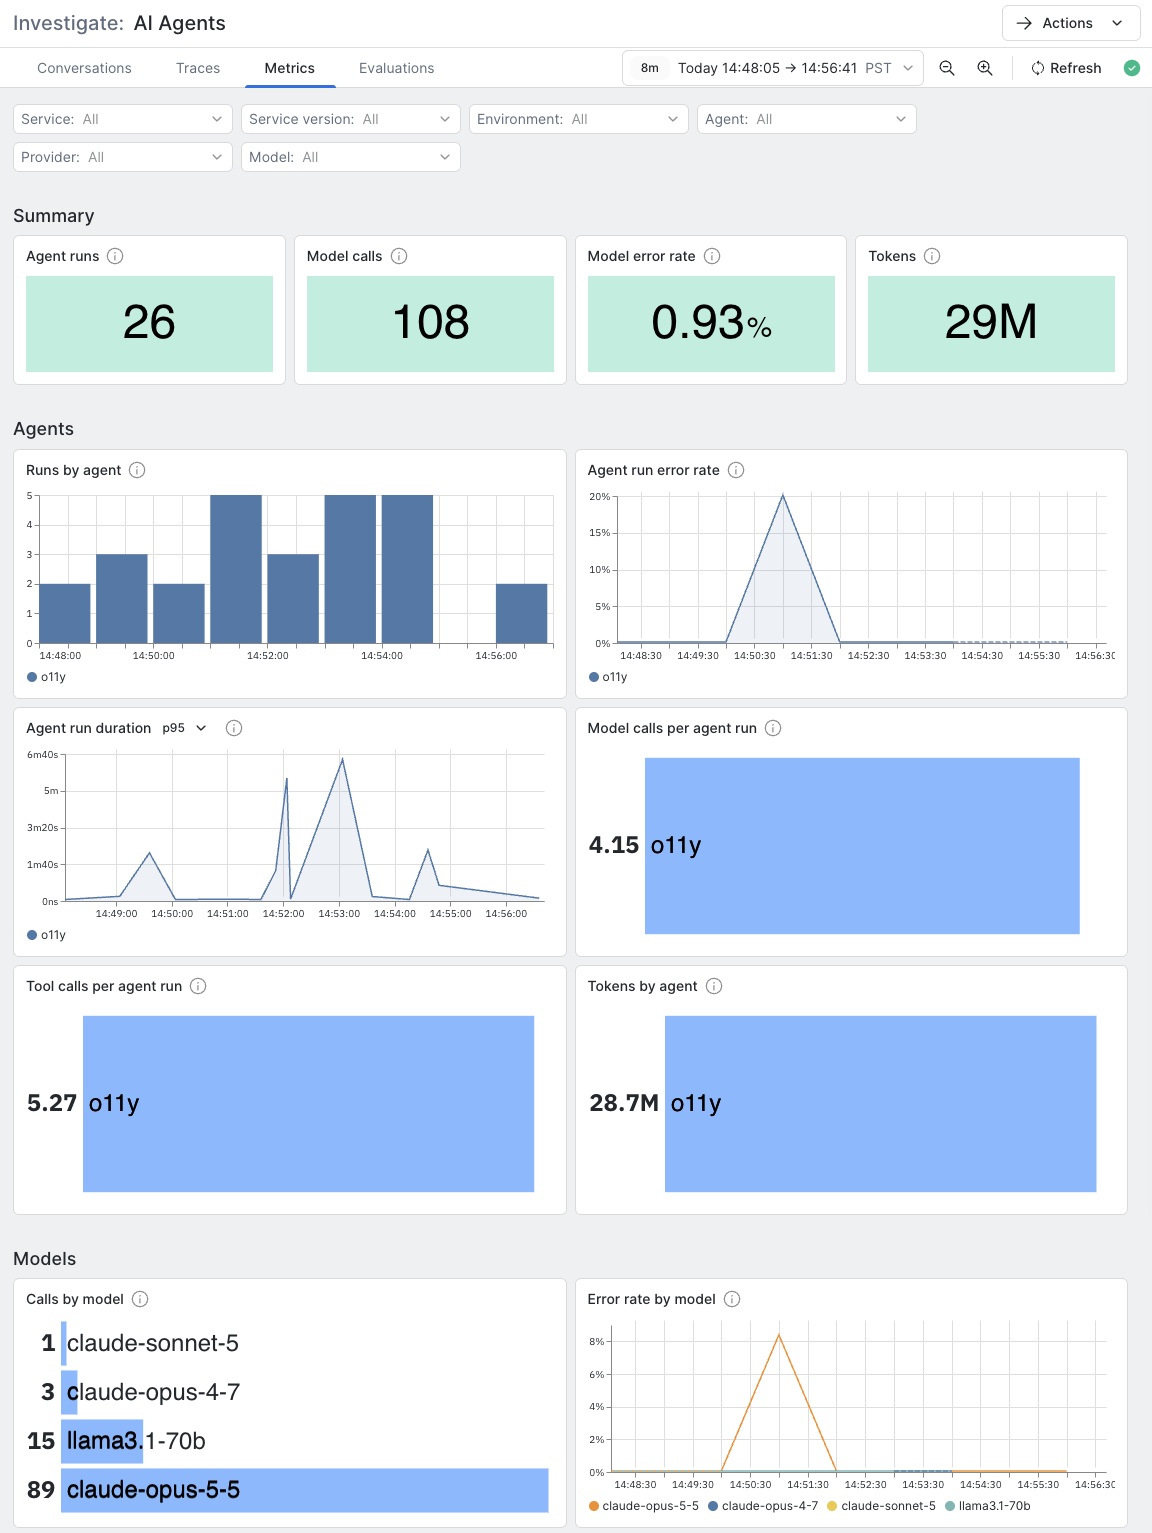
Set Agent to o11y. The page now shows only that agent's runs.
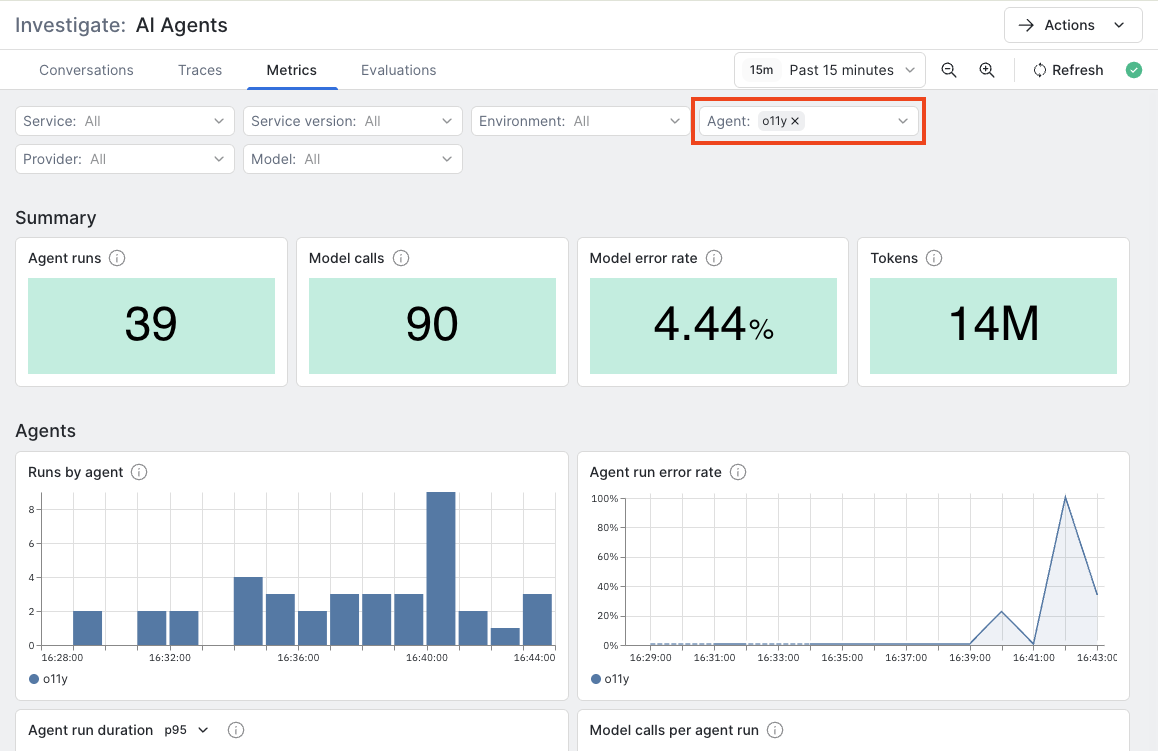
In this 15-minute window, the o11y agent had 39 runs, 90 model calls, a 4.44% model error rate, and 14M tokens. The Agent run error rate chart stays at 0% for most of the window. It rises to about 20% around 16:39, then reaches 100% around 16:41, and falls back to about 35% by the end of the window.
The two error numbers measure different things. Model error rate counts failed model calls across all runs. Agent run error rate counts agent runs that failed. The run rate can spike while the call rate stays low, so check the run rate when you care about whether a user's request completed.
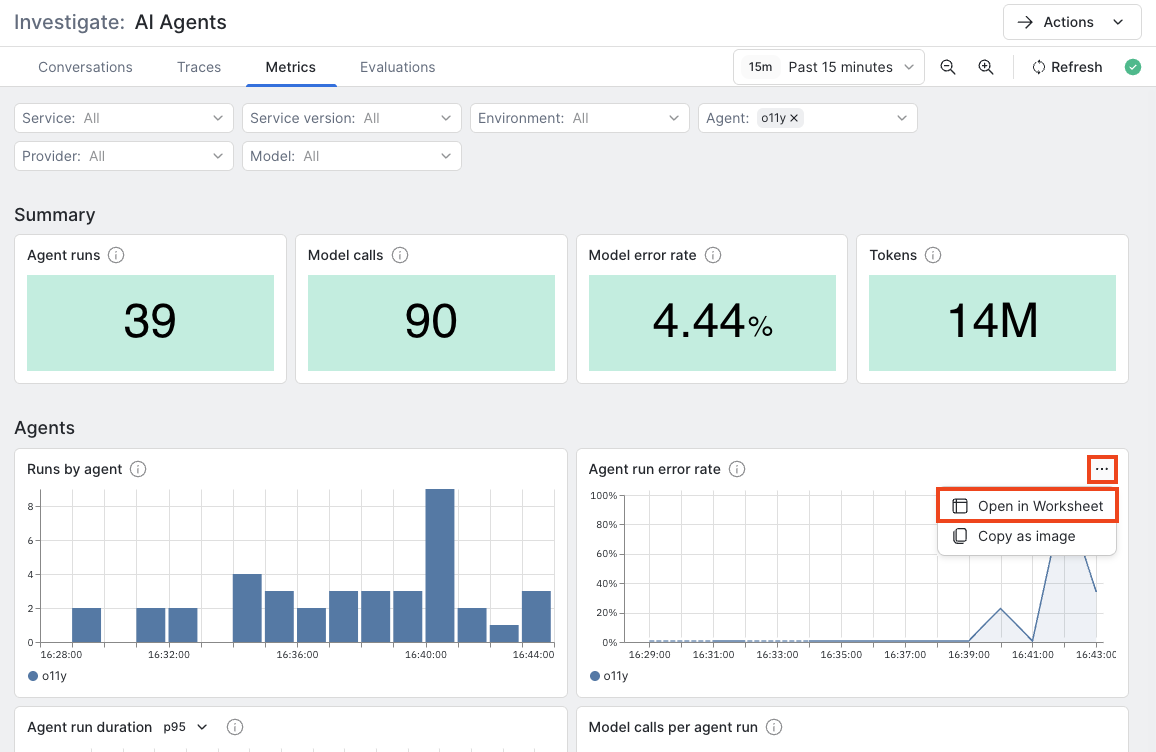
Click on the ellipsis icon () in the Agent run error rate card, then select Open in Worksheet.
The Worksheet has two queries and a formula that build the error rate from the gen_ai.client.operation.duration.count metric:
- A counts failed o11y runs.
- B counts all o11y runs with
gen_ai.operation.name = "invoke_agent". - C is the formula
A / B * 100, labeled Agent run error rate.
From the chart's More… menu, select Create a monitor.
In the chart, select More > Create a monitor.
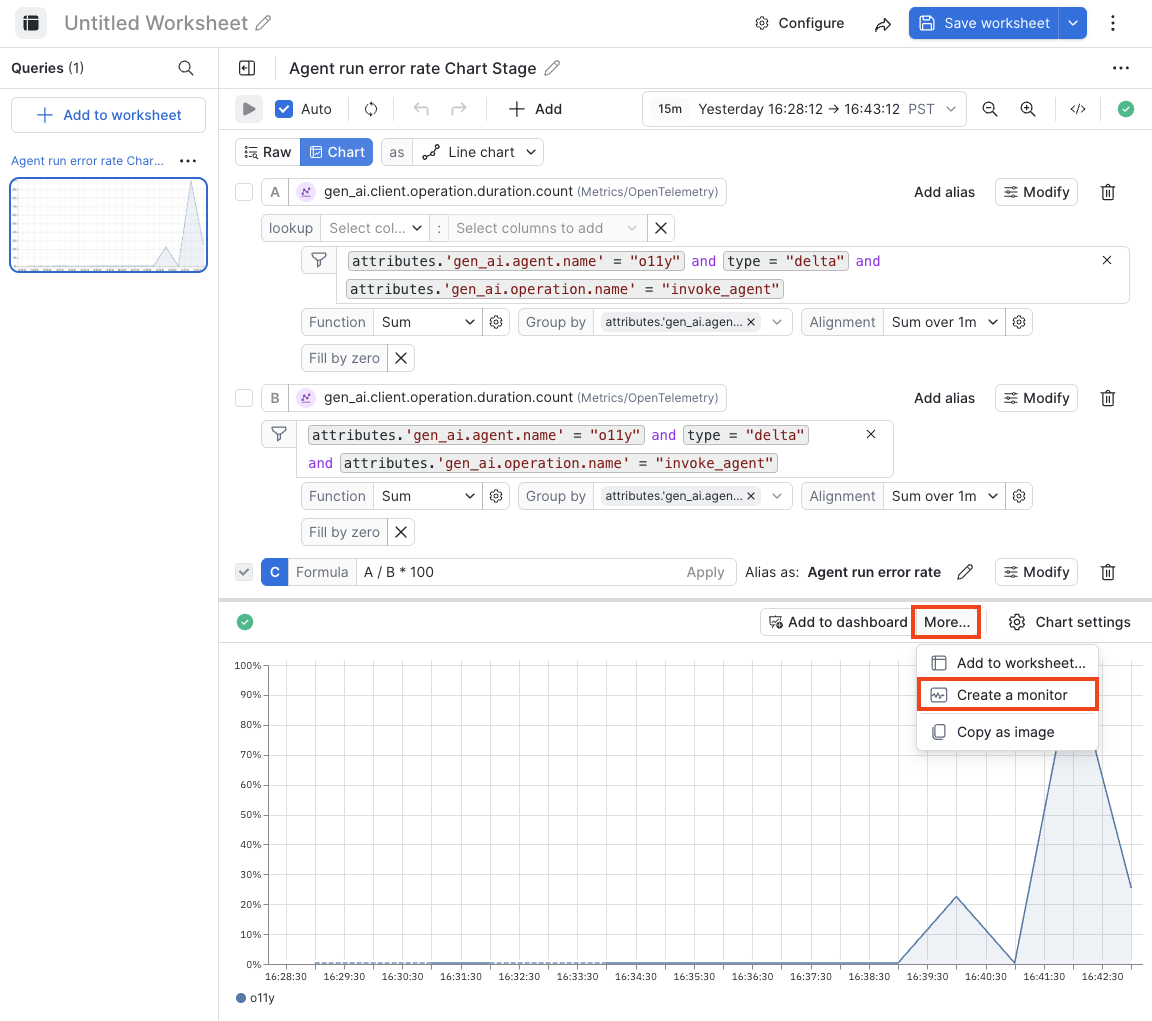
The monitor editor uses the same query as the Worksheet, so the Monitor watches the error rate you just read.
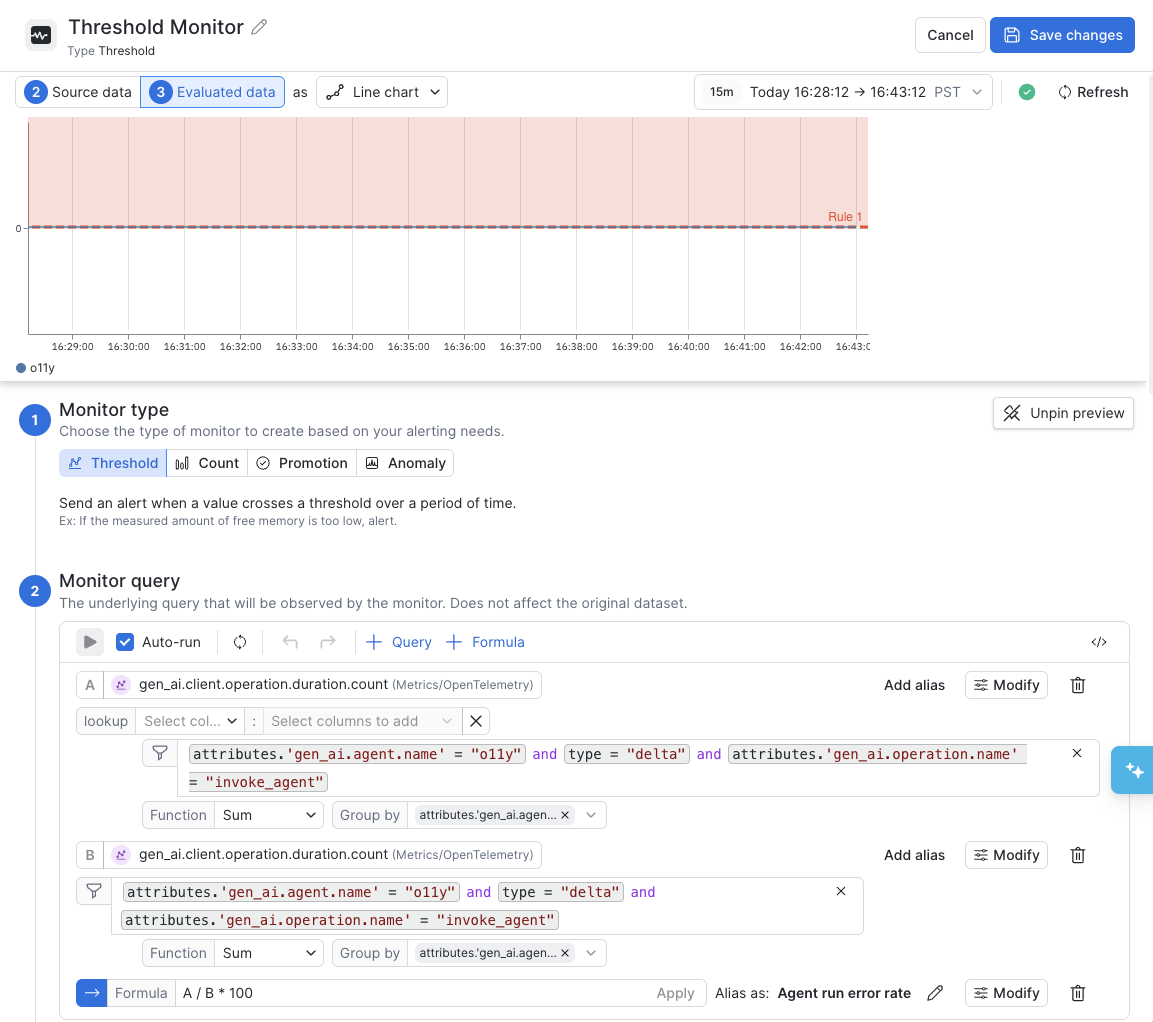
Complete the remainder of the Monitor configuration. For example:
- Set the threshold to fire an alert when the error rate is more than 5% over 15 minutes.
- Configure a notification action to notify someone when an alert is triggered.
See Create Monitors workflow for more information about the Monitor configuration options.
You can use this flow when a dashboard shows a spike you need to watch again. Find the spike on the Metrics tab, check the query in a Worksheet, and turn it into a Monitor so the next spike alerts you.
Updated 36 minutes ago